After a strong couple of months, the market does what it usually does—change up its dance routine just as many were getting used to the prior beat. Since mid-July (and especially late July), the sellers have been in control, putting a short-term ding into the overall market … and an intermediate-term clubbing to many growth leaders.
I’m always open to anything—maybe July proves to be a massive top and the market plunges to new lows as something goes horribly wrong in the world. You can never rule it out.
However, I also like the play the odds, and until proven otherwise, the odds favor this being a “normal” pullback that will resolve to the upside. Part of the reason for that is the avalanche of studies of the price action during the May-June timeframe—turns out when you have a big, prolonged decline, a decent bottom area and then a lot of strength, it almost always leads to higher prices down the road.
[text_ad]
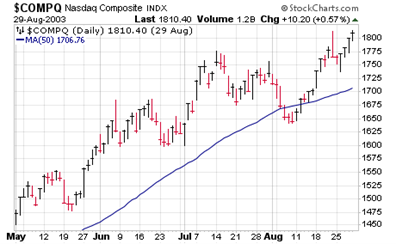
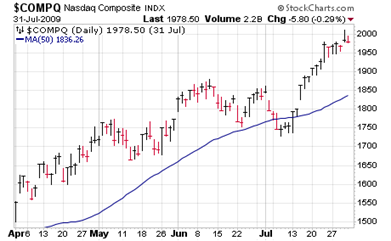
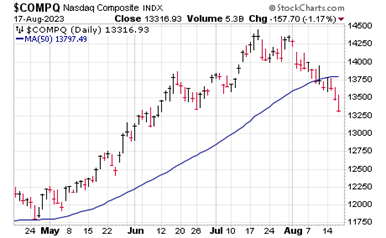
Another thing I’m watching is some precedent analysis that I talked about in last week’s (August 11) Cabot Weekly Review video. Take a look at the charts below of (a) the 2003 initial rally and correction, (b) the 2009 initial rally and correction, and (c) the Nasdaq so far this year.
Turns out, in 2003, the initial retreat (from the day after the high to the low day) lasted 18 trading days, took the Nasdaq down nearly 7.6% and dipped just below the 50-day line.
In 2009, the initial retreat lasted 18 trading days, took the Nasdaq down 8.1% and dipped just below the 50-day line.
And so far this year, the Nasdaq has pulled back a bit longer (21 trading days), has fallen 7.9% and dipped 3.5% below its 50-day line.
I’m certainly not putting all my eggs in the precedent analysis basket, but the fact is the majority of evidence (including the longer-term trend) still points toward the market resuming its uptrend once this correction finishes up.
==
But when will the market retreat be over? I’m watching five things closely for the “tell” that a resumption—possibly a powerful one—is underway.
5 Signals for the End of the Market Retreat
1. Growth Funds
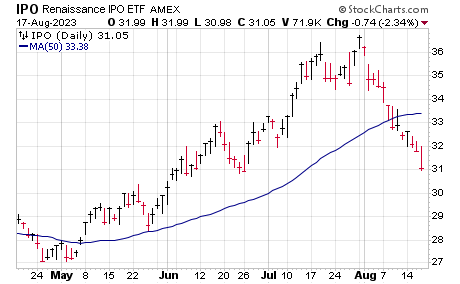
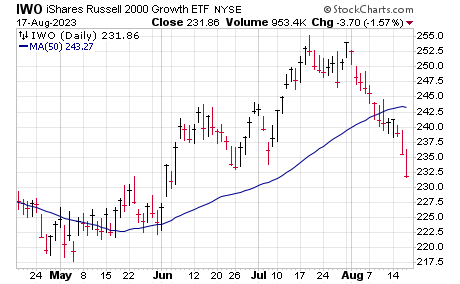
Growth stocks led on the recent rally … and they’ve “led” on the way down of late, too, with many growth-oriented funds and ETFs hitting the skids. Simply put, a strong snapback above the 50-day lines for stuff like Russell 2000 Growth Fund (IWO), the Renaissance IPO Fund (IPO) or even the Ark Innovation Fund (ARKK) would be a sign that big investors are starting to gain confidence.
2. Defensive Stocks
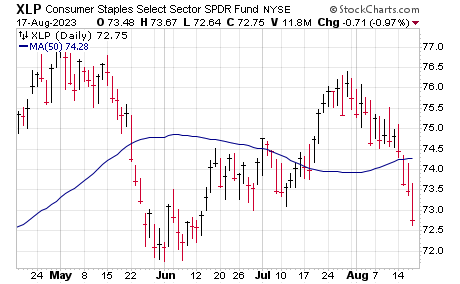
So far, I’ve been encouraged by the action of defensive stocks—the fact that something like the Consumer Staples SPDR (XLP) or the Invesco Defensive Equity Fund (DEF) have been sagging is a sign institutions aren’t rushing to safety. So what I’m talking about here is that continuing—if we start to see XLP or DEF reverse course and challenge their July highs, I’d be a bit wary even if some of the other factors on this list occurred.
3. Interest Rates (Our Power Index)
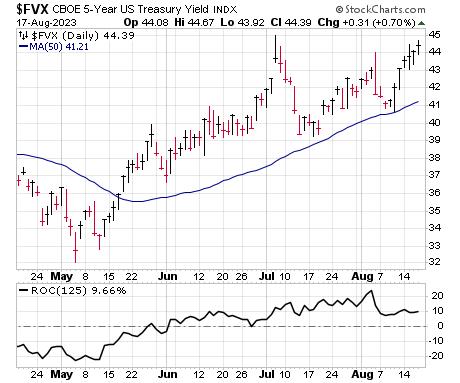
Interest rates are a secondary factor to me, as I’ve seen the market do well and do poorly and do mediocre among all kinds of interest rate environments. And, in fact, it’s not unusual for rates to rise early-ish in new bull trends as the market discounts a pickup in economic growth (that happened in the two examples in 2003 and 2009). That said, I also am not going to leave my brain at the door: In the past year, rates (and perception of future Fed action) have had a huge impact on the market, with the absolute peak of rates coming last October … right at the market bottom.
You can measure it a few different ways, but we’re looking for something like the five-year Treasury note yield to, first, fall back from its highs—an upside breakout would be bearish—and, moreover, we’d like to see the six-month rate of change (in the bottom panel of the chart here) get back below zero, which would mean the primary trend of rates has turned down. I’m not big into predictions, but my guess is if/when that happens, big investors will floor the accelerator, figuring the economy will be free to run.
4. Nasdaq New Highs
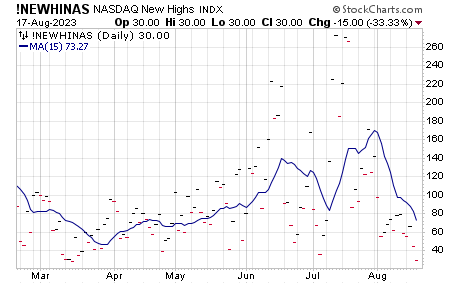
Back to market-based measures, one thing I’ve been doing a little research on is the movements in the number of stocks hitting new highs—it turns out they are a pretty solid short-term contrary indicator. When new highs expand for a few weeks, it’s usually a sign (or coincides with) sentiment getting a bit bubbly, but when new highs shrink for two or three weeks and turn up, it’s usually telling you the selling has passed.
Here’s a chart of the number of daily Nasdaq new 52-week highs along with a 15-day moving average—you can see that average has sunk below the early July low (a good near-term buy point) and is at its lowest levels since early May. A bit more of a dip followed by a turn up would be a sign the broad market is improving.
5. Resumption Patterns
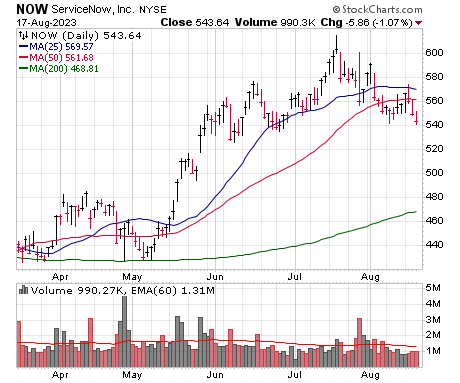
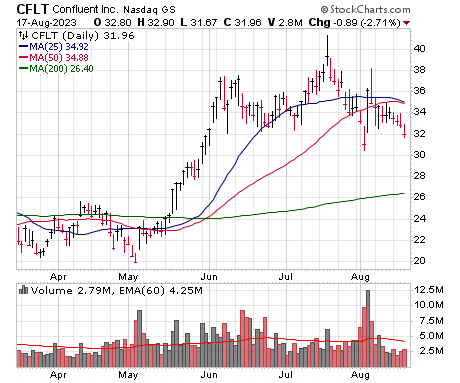
This won’t be a surprise to most if you’ve read me for a while, but probably the most important thing I’ll be looking for are some resumption patterns among individual growth stocks—basically looking for fundamentally sound growth titles that cracked intermediate-term support … but not too badly … have steadied themselves … and then they start to pop higher on solid volume. They don’t have to hit new highs but usually overcome some resistance with some power. Two examples:
On the big-cap side, ServiceNow (NOW) is a good example. It’s not the fastest horse anymore and did get hit after earnings, slipping below its 50-day line and to levels it saw in mid-May. But it hasn’t caved in, and a move into the 580 to 590 area would be noteworthy.
On the glamour stock side, there’s Confluent (CFLT), a name I’ve been watching since early June—it has the potential to be one of the key corporate IT infrastructure cogs, with a cloud platform that makes it easier for data to be spread across an organization (including into all of a firm’s in-house applications) in real-time. Even so, the stock could never quite get going—and after a spike higher in mid-July it came down hard. However, CFLT found good support after earnings in early August and has since quieted down—a push above 35 would be a first step, with a move into the upper 30s very intriguing.
[author_ad]

