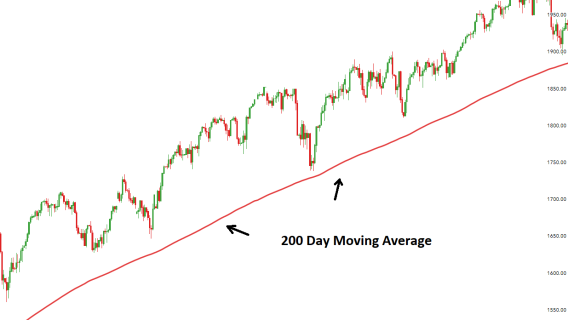
Today, I want to highlight something that shows up on practically every stock chart but still tends to be misunderstood: moving averages.
When I read charts, I’m not focused on the classic patterns you’ve likely heard of—pennants, triangles, head-and-shoulders formations, and so on. Instead, I’m interested in gauging supply and demand. I’m looking for subtle signals that reveal whether institutional investors—the real movers of liquid stocks—are accumulating shares or backing away.
At the end of the day, only two indicators give you a true, unfiltered read on supply and demand: price and volume. That’s it. Everything else on a chart ultimately stems from those two data points.
If I had to choose just two things to analyze, I’d stick with price and volume.
[text_ad]
Fortunately, I don’t have to stop there. Moving averages are a big part of my process, helping me refine both my buy and sell decisions. In simple terms, a moving average takes the last X closing prices, adds them up, and divides by X. So a 50-day moving average shows you the stock’s average closing price over the past 50 sessions. There are also exponential moving averages, which give more weight to recent data. They’re useful for some people, but I prefer to keep it straightforward.
The 50-day moving average is easily the most widely used of the bunch, and I treat it as a sort of dividing line between an intermediate-term uptrend and downtrend. On daily charts, I pair it with 25-day (short-term) and 200-day (long-term) moving averages.
There’s no magic formula for using moving averages—nothing inherently special about the 25-, 50-, or 200-day lines. But there are a few practical guidelines, ranging from the basics to more advanced tactics, that can help sharpen your buying and selling decisions.
8 Tips for Using Moving Averages
1. On the buy side, moving averages (MAs) are an easy way to eliminate those tempting story stocks that really aren’t performing. I have NEVER bought a stock that’s trading below its 200-day moving average, and have rarely bought one below its 50-day line. Simply put, if a stock is below these MAs, it’s not in an uptrend. It’s fine to watch it, but not to plow into it.
2. On the sell side, if a stock has been above its 50-day line for many weeks, and then breaks it decisively (for more than a few hours, on above-average volume, by a meaningful amount, etc.), it’s a sign the intermediate-term uptrend is over.
3. As a follow-up to #2, for individual stocks, you can use the same theory with a 25-day moving average at times. In other words, if a stock is super-strong and has been trending above its 25-day line for eight, 10, or 12 weeks in a row, and then it decisively breaks it, you can usually use that as a time to sell (or trim) your position, instead of waiting for the 50-day average to break.
4. On the flip side to #2 and #3, if a stock is base building for many weeks, and then pops back above its 50-day line, you can often buy some (or add a little to your existing position) right there.
5. I know many investors like to follow moving average crossovers, i.e., when the 50-day line falls below the 200-day line on the chart, it’s a sell—the so-called “Death Cross.” (Insert foreboding music here.) But I’ve never found much value in crossovers, as they tend to lag too much; if MAs themselves are secondary to price and volume, then MA crossovers are secondary to MAs ... and that’s one secondary too many for me.
6. One technique I learned back in the early 2000s is how to use moving averages to avoid getting into a stock too early. Say a stock is base building, then comes to life and quickly moves to new highs. Well, if the 25-day line is still below the 50-day line, it’s usually the case that the breakout attempt won’t work—it’s telling you the stock still needs time to set up. This doesn’t apply to a huge earnings gap, for instance, but it can help you avoid buying into what turns out to be a failed breakout.
7. As for buying at support on the 25-day or 50-day line, I’m all for it—in fact, institutional investors love to do that because there’s usually a chance to grab a good amount of shares. My only advice is to keep a relatively tight stop in place; if you’re buying at the line, the stock should find support very soon. If it doesn’t, the basis for the trade was wrong, so you should move quickly to cut the loss.
8. Lastly, I know many investors like to use the 50-day MA as a trailing stop of sorts. I’ve heard of worse ideas, but just remember that (a) tons of investors watch the 50-day line, which can lead to some false breakdowns, and (b) MAs, in general, should be considered fences that can be leaned upon, not hard-and-fast exact levels of support. Thus, the 50-day line is vital, but it’s best used as one selling tool among many.
All in all, I’ve always found moving averages to be helpful with my own chart analysis. They’re not the be-all and end-all, but they can improve your trading by strengthening your buy and sell decisions.
[author_ad]
*This post has been updated from a previously published version.

