Will oil and energy markets disappoint investors in 2024? If recent developments in one of the world’s biggest oil-consuming economies are any indication, it’s a real possibility.
As of late January, the WTI crude oil price is more or less unchanged from where it was a year ago. But it’s 20% below last year’s peak of $93/barrel and more than 40% under its high from 2022.
Meanwhile, a growing number of oil and natural gas-related stocks are starting to show signs of stress as certain economic factors relating to the energy markets deteriorate. Those factors specifically relate to the demand for oil from the world’s second-biggest oil consumer, and top oil importer, China.
China’s gross domestic product grew just over 5% year over year in Q4, which was less than most analysts expected—and favorable only when compared to a lower base comparison for GDP growth from 2022 of 3%. Other recent headline data further suggest weakening demand ahead for crude oil as it relates to China, especially in view of that nation’s rising oil inventory (it purchased record levels of oil last year in building its biggest-ever stockpile of more than a billion barrels).
Further underscoring fears that China’s economy is softening is the mainland China CSI 300, which fell to a five-year low in the wake of the disappointing GDP report. Moreover, the Shanghai Composite Index also just hit a multi-year low.
[text_ad]
In Hong Kong, the benchmark Hang Seng Index just fell to its lowest level in over two years. Moreover, the index just posted its biggest loss in a year on January 17 in a session that witnessed not a single advancing stock!
Then there’s the historical correlation between China’s stock market and the price of oil and oil stocks. And while it’s not always a perfect leading indicator, China stocks do tend to lead the broader energy markets at key turning points.
In recent years, for instance, a major drop in China’s stock market preceded an equally significant decline in oil prices in 2011, 2014, 2018, 2020 and 2022. In each case, either domestic policy or economic weakness were the catalysts for slackened oil demand in China, which first manifested in the form of a slumping domestic equity market.
Here in the U.S., weaker fuel demand has lately shown up in the form of a sharp drop in retail gasoline prices. Since peaking at a multi-decade high around $5/gallon in 2022, the nationwide pump price average has fallen 40%, now sitting just above $3/gallon. (According to Energy Information Administration data, gas price weakness is partly the result of surging gas stocks, which have recently risen 8% from a year ago).
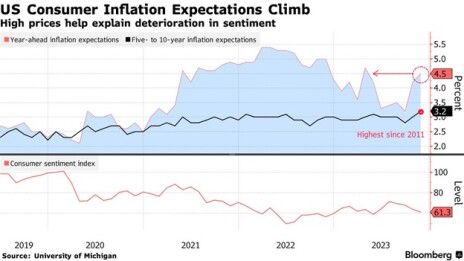
What’s more, a recent University of Michigan survey pointed to consumers anticipating U.S. retail prices in general to increase by around 5% in 2024. The implication here is that consumers are planning to reduce travel expenses in the months ahead, which in turn can lead to a further erosion in domestic fuel consumption—and eventually to even lower energy prices.
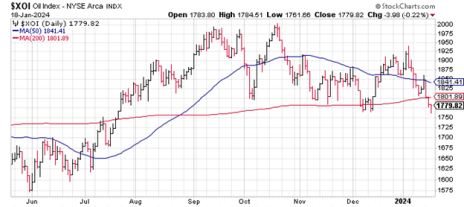
This brings up yet another point, namely the possibility that recent weakness in oil exploration and production stocks may be the market’s way of warning investors that lower crude prices lie ahead. On that score, the NYSE Oil Index (XOI) is currently testing what many market technicians consider to be a key chart support level at 1,760 (see chart below); a decisive break under this level would certainly lend some credence to this interpretation.
A final observation worth mentioning is the expanding number of energy stocks making new 52-week lows on the NYSE exchange. The latest casualty of the selling pressure was oil giant Exxon Mobil (XOM), which just made its first 52-week low since 2020. The growing number of oil/gas stocks on this list is a sign that internal selling pressure within the energy sector is slowly becoming a potential problem.
The energy sector makes up more than 10% of the S&P 500’s estimated net income, although it only accounts for around 5% of the index’s market capitalization. Therefore, the recent slump in energy prices doesn’t necessarily guarantee a bearish environment for the broad equity market. But if signs of diminishing global oil demand continue, investors might consider underweighting energy stocks in their portfolios.
[author_ad]


