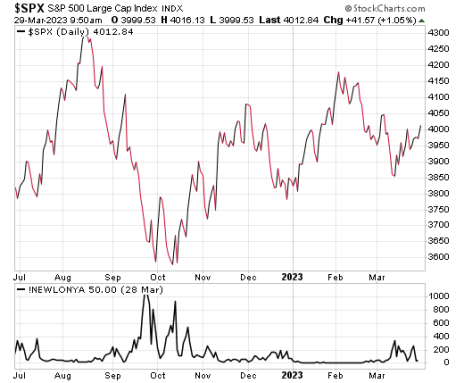
Well, it’s certainly been an interesting period of stock market history. It’s now been 15 months since the S&P 500 peaked, nearly a year and a half since the Nasdaq topped, and when looking at many glamour leaders (think ARKK and similar ilk), the top was two years ago (February 2021).
However, what are also facts are that most major indexes bottomed last October, five months ago—and effectively, most indexes actually bottomed last May or June. For instance, of the 6,100 points the Nasdaq has lost (top to bottom) in this bear market so far, 92% of those were lost by June of last year, and it’s a similar story to other indexes.
Said another way, just from a 10,000-foot view, it certainly looks like the market is in a prolonged bottoming effort; there are no guarantees of course, but the fact that the major indexes haven’t lost ground for months even as the Fed has hiked a huge amount and, now, we have issues in the banking sector, certainly leans toward the view that the market wants to go higher if (a big if) something else doesn’t come loose in the system.
[text_ad]
Which got me thinking: Given all the evidence out there, is there a prior time period in stock market history that resembles this? Of course, history doesn’t repeat, but there are three time periods I want to mention.
2011 Market Break
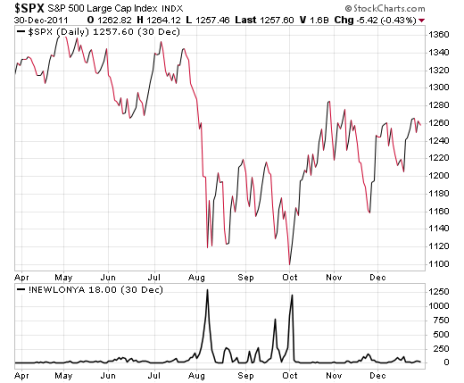
The first period of stock market history is 2011, when the market had a big hiccup due to European economic issues and some debt ceiling shenanigans. What catches my eye about this time period is that the major indexes are carving out a similar pattern—specifically, a big drop to the initial low that saw the number of new lows on the NYSE spike; then a rally that led to a second, slightly lower nadir with new lows again spiking; and then, unusually, a third tough retreat in November that set a much higher low (and saw new lows come in at tamer levels).
It’s a decent comparison, but it’s not my favorite—partly because the 2011 market break was a shorter-term (few months) thing that still saw many of the same leaders head higher in 2012 and beyond. The 2022-2023 bear phase has obviously been more of a whopper, especially for growth stocks … which leads me to the second bullish precedent.
2002-2003 Market Bottom
This one, to me, is a far closer comparison to the current environment for a few reasons. The first is that I consider the recent/current bear phase to be a “half” version of the Internet bubble popping. (In fact, if you look at a chart of the Ark Fund (ARKK) in 2019-2021 and compare it to the Nasdaq 1998-2000, you have another close precedent—but that’s a topic for another time.) Both time frames saw tons of speculation at the top and saw many long-term growth leaders fall 50% to 80% or even more—the 2000-2003 phase went on much longer and took the Nasdaq down much more (78%!), but this time around was half-ish of what we saw back then.
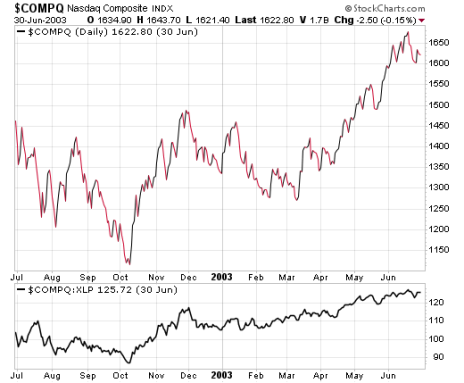
Anyway, as to the bottom (the first major bottom I was a part of at Cabot)—the Nasdaq bottomed in October, and that really was the low for most growth stocks, even the most beaten-down ones. The index rallied for a couple of months before backing off again as macro uncertainties grabbed the headlines (back then it was about the start of the second Iraq war and, of course, any terrorism that may come because of it). Interestingly, the final low was in March, which (a) brought far fewer new lows and (b) saw Cabot’s Aggression Index (Nasdaq vs. consumer staples) hold nearly all of its off-the-bottom gains.
Moreover, just being around back then, I can say there were many growth stocks that looked just fine even at the March lows (eBay, Yahoo, eResearch, XM Satellite Radio, International Game Technology—it was a bonanza). We’re not quite at that level at this point, but in a broader sense, the top (ARKK vs. Nasdaq), the bear phase itself (growth stocks blew off at the top and leaders were decimated) and the bottoming action before stocks took off (October low, growth stocks resilient on weakness into March) looks very similar to now.
What About 2008?
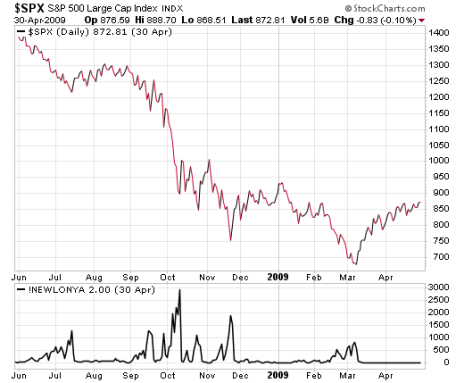
Of course, with the recent banking issues, the 2008 debacle is on many investors’ minds. And there is one similarity beyond just the fundamental worries—contrary to popular belief, the first many months of that bear market were garden-variety, with the indexes down 20% to 25%. It was only after the Lehman snafu and all the missteps that followed that we saw the market completely fall apart.
That said, that’s about where the similarities end—the post-July low in 2008 spawned only a modest rally (the indexes hit new lows two months later), and new lows exploded higher (and the Aggression Index tanked) during the September/October crash. And the bottoming phase in November-March of the following year doesn’t paint many similarities to 2023, either.
Conclusion
I never like to go too far with these comparisons—if knowing the future were as easy as looking back 10 or 20 years, then we’d all be rich, but unfortunately, that’s not how it works. Even so, as a student of the market, history does tend to rhyme, and having a general framework for the current environment can sometimes keep your head on straight (instead of getting lost in the headlines). No predictions, but right now, both the top, the action during the decline and the bottoming action bears a lot of resemblance to 2003—and if that continues, it would obviously be a good thing.
[author_ad]
