As market weakness persists while October winds down, the recurrent hope on Wall Street for a market low during the famed “bear killer month” is giving way to hope for a stock market bottom sometime before the year ends.
The yearning for an end to the selling in Q4 isn’t entirely without foundation, as we’ll discuss here. But first, it’s important that we examine some evidence that explains why the bears have been in control in recent weeks.
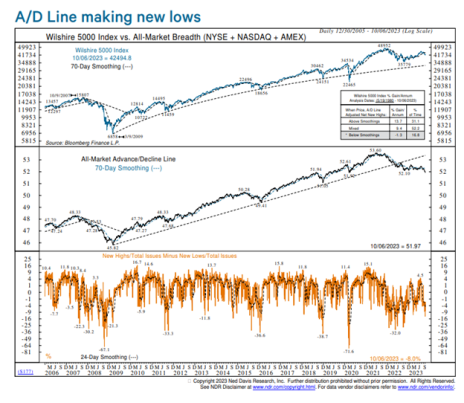
One of the biggest problems that has been overhanging equities since summer is the continued erosion of market breadth. And so far, widely followed statistics like the NYSE and Nasdaq Advance/Decline (A/D) lines haven’t provided investors with any hope that a bottom is imminent.
[text_ad]
While many respected analysts still believe this is a bull market, Ned Davis Research (NDR) recently addressed the erosion in the A/D line, noting that it underscores a “very weak bull market on an internal basis.” NDR further observed that in the ongoing secular bull market that began in 2009, “this is very much out of character.”
On a related note, breadth as measured by the number of stocks making new 52-week highs and lows has also been steadily deteriorating. On most days lately, new lows on both major exchanges have been in the triple digits while new highs have been in only the double digits—or worse—even single digits! That’s a good indication that the incremental demand for equities is on the wane. As such, it has been—and continues to be—bad news for the bulls.
You might be wondering why all the fuss over the broad market’s internal profile instead of focusing on the fundamental reason for the weakness. But therein lies the problem: it’s difficult right now to pinpoint a single catalyst for the selling pressure.
Granted that rising Treasury bond yields have been blamed for the market’s bearish behavior, but this blame can only carry so far. What’s more, the well-respected Ryan Detrick, chief strategist of Carson Research, noted in a video blog that rising Treasury yields likely aren’t a warning sign for the economy at all. Rather, he sees in them a sign of economic growth. If that’s the case, then the yield rally can’t be entirely blamed for equity price erosion.
Briefing.com expressed this problem last week when it noted that recent “disappointing price action” in stocks has itself “acted as a downside catalyst.” That’s another way of saying there really isn’t a clear reason behind the selling pressure. And that in itself is a concern since it means investors and policymakers aren’t able to easily identify the root of the problem (and therefore address it quickly before it gets further out of hand).
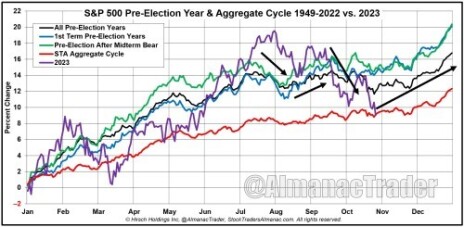
That said, there’s still a strong case to be made for stocks eventually establishing a major low at some point in Q4. Jeff Hirsch of Stock Trader’s Almanac (STA) has warned that widespread “Octoberphobia” is doing a great job of creating a potentially bullish (from a contrarian perspective) sentiment backdrop for a bottom, and that the seasonal and cyclical tendencies for October (including pre-election year tendencies—see chart below) are lining up for a potentially tradable low.
Hirsh further points out that STA’s famed “Best Six Months” begins the first week of November. This is the season when stocks typically outperform—especially if there has been notable weakness in the market prior to November.
For that to happen, though, we should ideally see three key developments take place in the coming days/weeks to let us know that sellers have indeed left the building. They are as follows:
3 Developments That Would Point to a Stock Market Bottom
1. Investor sentiment should reach “wash-out” levels of bearishness. For followers of popular sentiment gauges like AAII’s weekly poll, that means the percentage of investors who identify as bearish should reach somewhere around 50% or greater, which only happens at or near major lows). As of the last week of October, it was 43% (close, but not quite there yet).
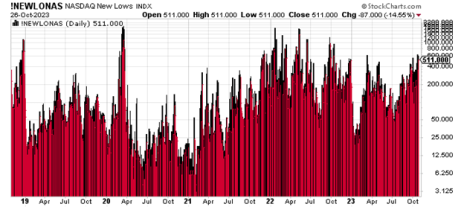
2. We should also ideally see wash-out levels of stocks making new lows on the NYSE and Nasdaq. To be exact, past major market bottoms have typically seen around 1,000 new 52-week lows or more on a single day for the Nasdaq (as the histogram below attests). If the new lows continue accelerating at the current pace, we could have a worthwhile market low in place in early November.
3. Finally, a major bottom should be accompanied by a trend reversal in the most popular safe-haven assets. Right now, the two safe havens of choice appear to be Bitcoin and gold. Both of these haven assets have been trading inversely to the major stock market indexes in October, so it stands to reason that if risk aversion is replaced by the return of risk tolerance, the money that has flowed into cryptocurrencies and precious metals will leave these assets and move back into stocks.
[author_ad]


