After what has seemed like an eternity of market turbulence and failed rally attempts in the last few months, stocks are finally showing signs of establishing a meaningful bottom.
Across virtually all 11 S&P 500 sectors, the evidence continues to mount that the bear market of the first half of 2022 will soon be history. Meanwhile, a new bull market is likely not far from being confirmed (though it could take several more weeks before a bottom is firmly established).
Without going into too much detail, here are five basic indicators that suggest the market’s recent action is likely to prove successful at ending the bear market and ushering in a new bull market.
[text_ad]
5 Signs the Stock Market is Bottoming
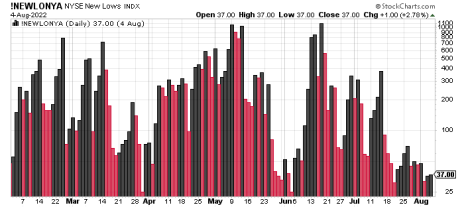
1. New 52-week lows on both the NYSE and the Nasdaq are drying up. Until now, this has been a big problem for several months, as the number of stocks making new lows has remained consistently above 40—and often in the triple digits—for much of this year. The Cabot Two-Second Indicator states that more than 40 daily new lows over a period of several days-to-weeks is a sign of abnormal internal selling pressure, which in turn often precedes (or accompanies) a bear market. However, when the new lows fall below 40 and consistently remain below this level (see histogram below), it’s a sign that a normal, healthier market condition has returned. We’re not quite there yet, but it looks like the market is headed in that direction.
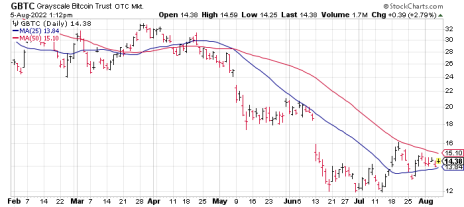
2. Bitcoin and crypto-tracking ETFs are trying to bottom, as shown in the chart of the Grayscale Bitcoin Trust (GBTC). This is an important indicator for the stock market since cryptocurrencies like bitcoin have become a favorite speculative medium for the younger generation of traders. Consequently, when they feel like embracing risk, they typically turn first to the crypto market before turning to stocks. Moreover, in recent years there has been a tendency for bitcoin prices to lead the stock market at pivotal turning points. A decisive close above the 50-day line in GBTC would go a long way toward confirming the end of the cryptocurrency bear market (at least from an intermediate-term standpoint).
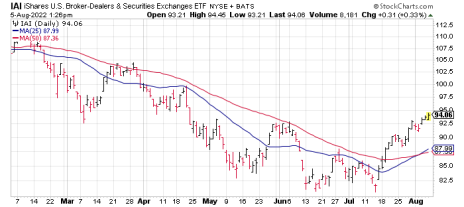
3. Broker-dealer stocks are bottoming and are showing improved relative performance versus the S&P 500 index. This is an important consideration for the broad market outlook since broker-dealers are another class of stocks that typically lead the S&P at critical junctures (due to the obvious sensitivity of this industry to shifts in prevailing market winds). Note that the iShares U.S. Broker-Dealer & Securities Exchanges ETF (IAI) is above its key trend lines as of early August.
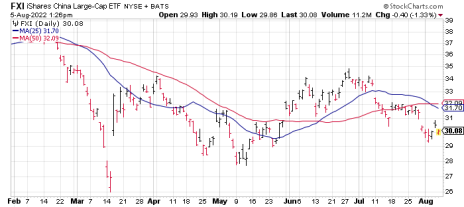
4. U.S.-listed China stocks are showing signs of returning strength. Like the other indicators mentioned here, Chinese equities have a multi-year history of leading U.S. stocks at key turning points. Prior to the latest bear market for the S&P, one of my favorite China-tracking vehicles, the iShares China Large-Cap ETF (FXI), peaked in February 2021 and began a downward spiral that didn’t end until March of this year. This preceded the bear market in the U.S. stock market by almost a year, but true to form, the bottom in FXI also occurred before the recent low in the S&P. Although FXI hasn’t yet recovered above the key 25-day and 50-day trend lines, China ADRs are in the process of base building and look like they’ve established intermediate-term lows. A decisive upside breaking in FXI (i.e. above 34) would be a strong indication that not only has China’s market turned favorable for the bulls, but it would also lend credence to the bullish thesis for U.S. stocks.
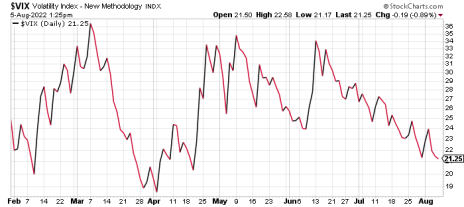
5. The CBOE Volatility Index (VIX) is back below the 25 level and trending lower. This is an extremely important consideration for investors, for history shows that whenever the VIX is above 25, the environment is decidedly unfriendly for purchasing stocks. What’s more, when the VIX is under 25 and consistently falling further beneath this benchmark level, it suggests the trading backdrop is becoming increasingly favorable for the bulls. As of this writing, the VIX is at 21 and has been declining; the last time this occurred was back in March which, incidentally, was the last time the S&P had a meaningful rally.
At least three of the five indicators mentioned here are already in positions that can be described as consistent with bullish market conditions. The other two indicators—cryptocurrencies and the China ETF—still need some more work but are definitely headed in the right direction. All things considered, the composite picture provided by these five indicators suggest the U.S. broad market is bottoming and that a renewed bull market could be underway within weeks.
Have you been noticing other signs the stock market is bottoming? Tell us what indicators you’ve been tracking in the comments below.
[author_ad]

