Among the many truisms bandied about on Wall Street, one is that bear markets never bottom out on good news. Mid-October brought a cascade of negative news and bearish sentiment, all of which pushed stocks to what I see as an important mark two weeks ago: they finally surrendered half the gains from the last bull move, as measured from the pandemic panic’s bottom of March 2020 to the peak of December 2021. That’s bad, you say. Well, sure – it hasn’t been a pleasant environment to invest in. But a 50% retracement (losing half its pandemic bull move) is a good sign.
Why is that? It’s a classic market move that often augurs the revival of the bull market. Known as a 50% retracement, this move is important to technical analysts like me – and to many of the market-moving hedge fund managers who rely on the technique.
[text_ad]
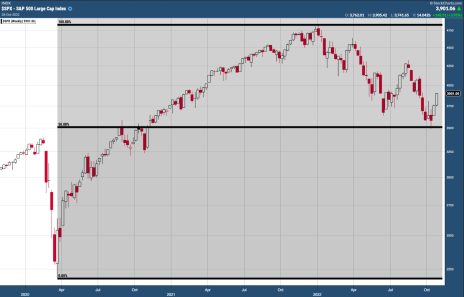
Here is a weekly chart of the recent retracement from March 2020 through last week. The shaded spans the bottom of the pandemic panic to the peak of the bull run entering this year. The top and bottom black lines frame the full more, while the center black line is the 50% retracement line for the S&P 500 index.
We know markets move in cycles that are bullish and bearish depending on your time frame. Early in the development of modern technical analysis about a hundred years ago, a trader and analyst named William Gann noticed that a healthy bull market typically will have down periods where half of the gains of any leg will be surrendered before moving higher again. This is a Gann retracement, and we see it over and over again in long-term upwardly trending markets. This 50% retracement move is also often included in the more attractively mysterious (or mumbo-jumbo-like, depending on your view) Elliot Wave Cycle and Fibonacci approaches to the markets. Whatever you call it, it suggests we could be at an inflection point. I alerted Cabot subscribers to this bullish pivot on October 19, just three trading days after the 50% mark was touched. Here’s what I wrote to subscribers then:
“One sign of that is that upon hitting [the retracement level], we saw a big bounce on Thursday and good follow-through. The bears have yet to unwind the gains made so far since. Every day that happens is further confirmation that this is a potentially significant bottom.”
And as you read this today, the bears still haven’t fought back with any consequence. The potential for stocks having bottomed is getting ever-stronger. We’re not out of the woods yet – there will be pushback about 5% over current prices, where the long-term resistance of the 200-day moving average sits. But it’s quite possible one day we’ll look back to October 13 as the start of a new bull market.
By and large, this mark has been dismissed by the financial press. Overconfidence on how bad everything is by pundits is one of the signs I look for as a signal a bear market could be ending. My favorites for this are Barron’s, which has called the recent buying noise and even silly, and The Economist, a perpetual contrarian indicator of the health of the American markets. Don’t dismiss the significance of overconfident, bearish financial editors.
Another, harder-to-quantify sign we may have bottomed: it occurred in mid-October. Bear markets often bottom in mid-October as people throw their hands up in despair with the market and sell. Known as capitulation, there are many fascinating reasons why this happens regularly in October. Perhaps it’s a psychological coming down from the lazy, happy days of summer. Maybe October negativity is a self-fulfilling memory from the 19th century and earlier, when October meant banks were worried and cash-strapped as the more agrarian society went through harvest season. There’s even a surprisingly credible theory that autumn sell-offs and panics are linked to the position and gravitational pull of the moon.
But back to more tangible indicators.
There are five classic signs of the end of a bear market, known as Schabacker’s Rules, after a technical analyst who was an early developer of Dow Theory on the markets. What are they telling us?
- Stock prices are declining and bad news is everywhere. We know the former and I see the latter, as explained above.
- Commodity prices have declined. You may not believe this, especially as winter heating bills start coming, but key commodity prices – grains, softs, metals and yes, heating oil and natural gas – are all downtrending from June peaks.
- Trading volume is low. Here our thesis starts to show cracks. Trading volume is a little lower in recent months than what it has been. It’s trending in a confirming direction but isn’t convincing. However, growth stocks that report good news haven’t been sparking buying –such indifference I take as a confirming sign.
- Corporate earnings are low. Based on FactSet data through the first half of the year, earnings have been lower – half the S&P 500 missed earnings targets in the second quarter – but overall, they’re still growing, albeit more slowly. It appears as we’re into third-quarter earnings season, large-cap earnings continue to disappoint.
- Interest rates have declined. U.S. interest rates have been doing the opposite, so chalk another indicator in favor of the bears. However, compared to some of America’s largest trading partners – Canada, Mexico, the E.U. – one could argue U.S. interest rates are in relative decline, in that they aren’t rising as fast. Think of passing another car on the highway: it’s still moving, but on a relative basis to you they are reversing.
Lastly, there is a calendar argument, as pointed out by Tom Bowley, chief market strategist at EarningsBeat.com: The market entered its best time of year the end of last week. Since 1950, the S&P 500 has on average gained an annualized 21% from October 27 into January 18. The period we just exited, July 17 through October 27, has seen an average annualized decline of 1.3% the past 71 years.
[author_ad]


