The Nasdaq has technically entered correction territory. What comes next? Here’s how the last three Nasdaq corrections played out.
Thirteen trading days. That’s all it took for the Nasdaq to lose 10% of its value in the last three weeks, bottoming at 12,723 last Thursday. While the S&P 500 (-4.5%) and especially the Dow Jones Industrial Average (-3.2%) declined far less, the Nasdaq briefly touched correction status, as tech stocks – particularly unprofitable upstarts that had been going through the roof in the months prior – have broken down in a big way. Where do they go from here? Let’s look back at several recent Nasdaq corrections to try and glean some information.
Nasdaq Correction #1: February-March 2020
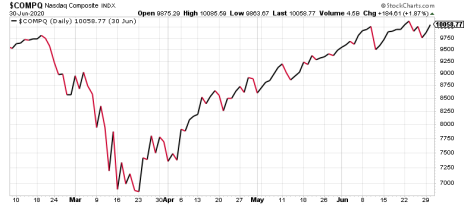
The last one is easy to remember. It was the same time a year ago (a bit eerie, no?), when the entire stock market crumbled as Covid-19 spread across the world and officially became a global pandemic. The Nasdaq topped at all-time highs at 9,817 on February 10 (this year it was February 11…); by March 23, it was all the way down to 6,860—a 30% decline in just six weeks, one of the swiftest and deepest crashes in stock market history.
[text_ad]
Thankfully, it didn’t last long. You know what happened next. Stocks improbably mounted a V-shaped rally, regaining all of their February and March losses by the first week of June.
They’ve since added another 20%, even with the recent collapse in growth stocks.
Nasdaq Correction #2: Fourth-Quarter 2018
This one seemed like a major deal at the time. Now it seems like small potatoes.
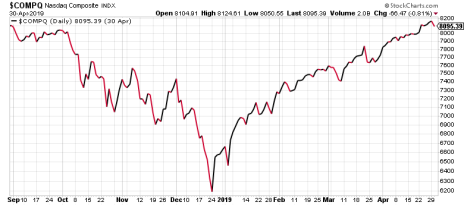
Nevertheless, this was a true correction; prompted in part by escalating U.S.-China trade tensions, the Nasdaq fell 23% from September 28, 2018 until a Christmas Eve bottom. That was a long three months for growth stock investors, especially considering the time of year; the holiday quarter is typically a fruitful one for investors, as it was last year.
Again, stocks didn’t stay down too long. By late April 2019, the Nasdaq was establishing new all-time highs—a full recovery in just four months.
Nasdaq Correction #3: Late 2015/Early 2016
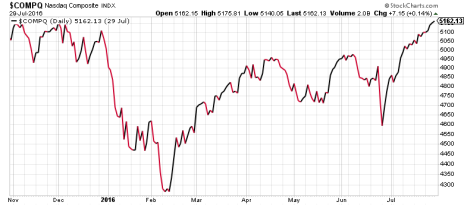
Remember this one? I barely do. It happened a little more than five years ago, at the tail end of the Obama era. And it wasn’t nothing: from the last day of November 2015 until February 8, 2016, the tech-heavy index lost more than 15% of its value. This time, the recovery took a bit longer; it wasn’t until late July 2016—nearly six months later—that the Nasdaq recovered all its losses.
That’s three true Nasdaq corrections in just over five years. After each of them, it took the index less than six months to recover and stretch out to pre-correction highs. And it’s clear that the steeper the fall, the swifter and sharper the rebound.
From top to bottom, last year’s scary February-March coronavirus crash took six weeks. The recovery took about two and a half months.
The trade war collapse in Q4 2018 took three months to find a bottom. The bounce-back took exactly four months.
And the more modest 2015-2016 correction took about two and a half months. Despite the mere 15% decline, the Nasdaq needed close to six months to recover.
Right now, the current correction has lasted less than a month. If stocks stabilize this week, few people will even remember it as a real correction. Or, based on recent history, we could have anywhere from three weeks to two months until the buyers truly step in. The extreme divergence from the S&P and the Dow shows that this isn’t a broad market correction yet—not even close. So either those two indexes will crack too, and a deeper, broader correction will ensue. Or tech stocks will quickly find support, and this will be little more than a three- or four-week blip.
We should know which it is by the end of the week.
[author_ad]


