As the coronavirus continues to spread across the globe, investor fear is not only palpable, but measurable. Last week the CBOE Volatility Index (VIX), often referred to as the “investor fear gauge,” topped 40 for the first time in more than eight years.
The VIX has since pulled back to the low-to-mid 30s, as the initial shock of the rapid coronavirus spread and subsequent sell-off has worn off, as Monday’s record point gain in the Dow Jones Industrial Average suggested. That said, investor fear remains quite high, as the VIX is still higher than it’s been since 2011.
What happened in 2011 that caused such panic? I couldn’t think of it off the top of my head. The SARS outbreak (2003) and swine flu pandemic (2009-10) came earlier, as did the subprime mortgage crisis (2008-09). To my surprise, and only to my vague recollection, the last spike above 40 in the investor fear gauge was caused by a credit downgrade of America’s sovereign debt, from AAA to AA+, by Standard & Poor’s. How quaint that seems today!
[text_ad use_post='129622']
Granted, at the time, investors were still a bit snake-bitten from the recession, just two and a half years removed from the bottom. Thus, further bad news about the U.S. economy was bound to cause at least some level of panic on Wall Street. But the panic didn’t last long.
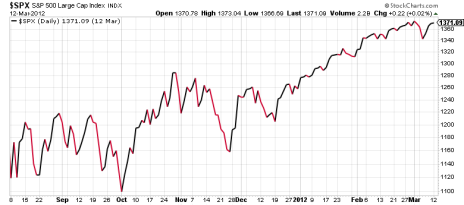
After the credit downgrade on August 8, 2011, the VIX spiked to 43 a week later. By early September, it sagged back to the low 30s, but then jumped right back up to 43 in late September. A month later, however, the volatility index was back in the mid-20s, and by March it was all the way down to below-average levels at 14.
Here’s what stocks did during those seven months, starting with the August 8 credit downgrade:
That’s right – they were up. Way up!
The S&P 500 started to sag a few weeks before the downgrade, and fell 17.6% from the April 2011 to the mid-August nadir. The index re-tested that bottom in late September, as the VIX was spiking again. It took until the third week of February for the S&P to fully recover its credit-downgrade losses. All told, the recovery took about seven months.
Other Investor Fear Gauge Spikes
Of course, those were different times. Even after the post-credit downgrade recovery, stocks still hadn’t regained their pre-recession highs. Valuations were low. And America’s economic recovery was starting to accelerate. So comparing this spike above 40 in the investor fear gauge to the last one is fairly apples-to-oranges.
So, let’s go to more recent VIX spikes.
In August 2015, the VIX gapped from 12 to 28 in just a couple trading days. Stocks tumbled 8% in the ensuing six weeks, and after a quick recovery, fell to new lows in early February. The peak-to-trough decline was 12.3% in seven months, or roughly what the S&P 500 lost on a percentage basis last week! So perhaps that’s not a great comparison either.
Perhaps the most apt comparison is to what happened came in late 2018: the infamous fourth-quarter market correction of 2018. The VIX topped 30 in late December that year, and the S&P dipped nearly 20% from late September through the Christmas Eve sell-off.
Like the current correction, stocks entered that one at all-time highs after months of gains. Like the current correction, fears of a global recession added fuel to Wall Street’s sell-off. And like the current correction, valuations were much higher than the historical average when it began.
You know what happened next. U.S. stock markets took just four months to fully recover, and 2019 ended up being the second-best year for the S&P 500 this century.
Can we expect a similar recovery this time around? It’s way too early to tell. A lot will depend on how long it takes for the coronavirus outbreak to be contained. The damage done to the global economy also looms large. And, of course, a pretty important presidential election is just eight months away.
Here’s what I do know, from the data mentioned above: every time in the last decade that the investor fear gauge has made a quantum leap, and stocks have plummeted for weeks and sometimes months, it look less than a year for them to fully recover.
Thus, as bad as things look now and will probably look a week from now and maybe even a month or two from now, it’s very likely that a year from now, stock prices will be higher than they are today, and higher than they were a month ago. So when stocks start a new, sustained uptrend—and it’s highly unlikely they’ve done so yet—you should be buying. Who knows how long it will take for that to happen. But eventually, it will happen.
[author_ad]

