One of Cabot’s most important rules for growth investors is to stay in step with the market. In action, that rule translates to: Buy into the market when it’s going up and sell when it’s going down.
And in order to follow the trend of the market, we have to know what the trend is.
Our main tools for determining the trend of the market are simple moving averages of the major indexes. When the indexes are above their 25- and 50-day moving averages, conditions are likely positive for growth investing strategies.
But while the trend of the market is so important, it’s also useful to have a historical sense of how the market has done over the years. And Cabot has a unique, hand-crafted way to do that. And we call it The Big Black Book.
Our Big Black Book: Nine Decades of Investing Lessons
The Book is a three-ring binder a foot high and 20 inches wide that has hand-drawn market charts going back to 1930. The charts for the years before Cabot’s founding in 1970 show only the Dow Jones Industrial Average and the Advance-Decline (AD) line from the New York Stock Exchange.
[text_ad]
But Cabot’s founder, Carlton Lutts, was always eager to innovate, and in the 1980s, he added the number of stocks making new 52-week lows each day on the NYSE, eventually entering that data all the way back to 1963. Then in 1992, the Nasdaq was added. And along the way, if you were to page through the book, you would see moving averages, convergence/divergence (MACD) lines and Bollinger Band lines appear for a few years and then disappear when it was discovered that they didn’t add value for growth investors.
Most years begin with the three lines—the Dow, the Nasdaq and the AD—starting low on the page to leave room for advances. And that’s because the stock markets usually advance in the course of a year.
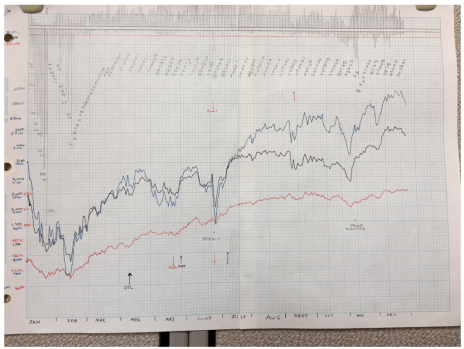
Here’s a photo of the actual chart for 2016, with the AD line in red, the Dow in black and the Nasdaq in blue. The new 52-week lows are the descending pencil lines at the top and the 52-week highs are the ascending lines. You can also see notes on changes in the Cabot Trend Lines, the Cabot Tides and a few news stories (the Brexit vote in June and Trump’s election in November). The credit-crunch correction in January and February needed no explanation.
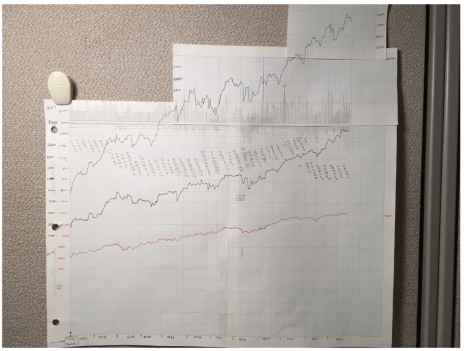
In most years, the charts fit nicely on a couple of standard sheets of graph paper. But occasionally the markets can make such big moves that some adjustments are necessary. So, just to keep things in perspective, I thought you might like to see what happens when the markets really go nuts to the upside or the downside. In that case, we sometimes have to add an additional piece of graph paper (or two) to follow the move. Here’s how the Book handled the big bull market of 2017.
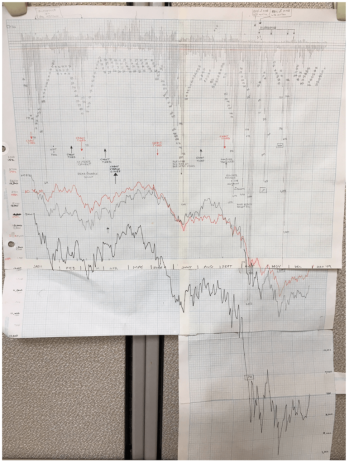
And lastly, because everyone is worrying about the current minor pullback in the indexes and many growth stocks, here’s what a real bear market looks like. This is the chart for 2008, when the housing bubble burst and the hyper-leveraged banks, investment houses and individuals investors went through the wringer. Highlights (well, lowlights actually) include the July low when investors feared FannieMae and FreddieMac would go bankrupt and the 2,901 new 52-week lows registered in October.
Personally, I think all growth investors should have a print of the 2008 chart on their walls, just to remind them to take the power of the market seriously. Because I know there were investors who just hung onto their stocks like grim death during the entire year, hoping and praying that things would get better.
They did get better, but not before their portfolios had hemorrhaged so much red ink that it would take years to get back to even.
The Cabot Big Black Book has a lot of lessons to teach, and Cabot analysts (like me and Mike Cintolo) never forget them. We were the ones who had our subscribers mostly in cash during much of the 2008 market collapse and completely in cash for part of it. The truth of the old saying, “A penny saved is a penny earned,” was never truer.
[author_ad]


