When you get right down to it, investing is about trying to put the odds in your favor. You try to find low-risk stocks with plenty of growth potential. I try to do this a variety of ways: market timing (only buying during major uptrends), sector analysis (I don’t want to buy if the entire sector is the dog’s dinner), fundamental analysis (rapid sales and earnings growth, good estimates, a unique product or service, etc.), and chart analysis.
That last part—examining a stock’s chart—is key. Most important of all, I want stocks that are trending up in general. That tells me big investors are generally in accumulation mode.
To further increase my odds of success, I look for specific chart patterns that have shown to have a very good chance of producing lower-risk entry points for winning stocks.
Two of my favorite setups are Persistent Pullbacks and Shake-and-Snap patterns—and what’s amazing is that, while these patterns aren’t common, I’ve seen a ton of both during the past couple of weeks, offering up many intriguing, high-odds buying opportunities.
[text_ad]
As a disclaimer, there are no sure things in the market.
Let’s review both setups and look at some examples.
Low-Risk Stock Buy Point #1: Persistent Pullbacks
A persistent pullback is simply when a stock has been trending higher on its chart for many weeks (usually at least five weeks if not many more) in almost a straight line—no huge gaps up or sideways periods, but pretty much just plowing ahead at a consistent rate every week. Then the stock pulls back, which can be either gradual over a few days, or short and sharp, often coinciding with a quick market dip.
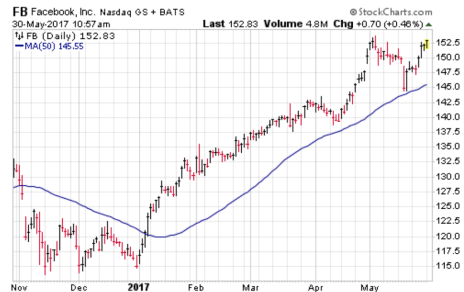
Facebook (FB) is a good example of the gradual pullback earlier this year. The stock had a great first few days of the year and then plowed ahead persistently through February and March. Then came a modest dip over 11 trading days, dropping the stock a few points and getting it close to its 50-day line. You can either buy on the dip or, preferably, after the stock has started to rebound. So far that’s been a good trade and the stock’s overall uptrend is continuing.
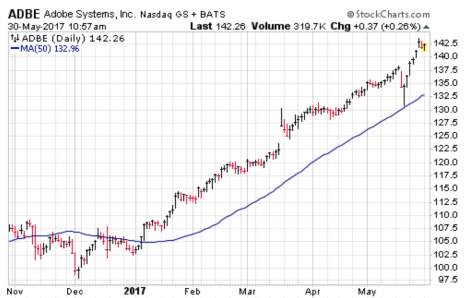
Adobe Systems (ADBE) is an example of a persistent pullback that featured a sharp, scary decline. Look at how ADBE has been chugging higher all year; there was a small earnings gap in mid-March, but shares have basically been in a persistent, steady uptrend for months. Then, during the market’s huge Wednesday/Thursday morning shakeout two weeks ago, ADBE had quick, sharp decline toward its 50-day line. The recovery from that dip was a buying opportunity, and sure enough, ADBE has cranked ahead since.
Low-Risk Stock Buy Point #2: Shake-and-Snap Patterns
A Shake-and-Snap pattern is when a stock is in an overall uptrend but then begins correcting and eventually breaks down below support (often its 50-day moving average). That action—the shake—usually gets rid of most weak hands and attracts some eager shorts. (Note that I’m not talking about a complete breakdown, like a giant huge earnings gap, but instead a dip of a few percent below support.)
But then comes the “snap” part of the pattern. After the shake, the stock will nearly immediately snap right back, often on huge trading volume, providing a lower-risk entry point. Most investors have a hard time buying back a stock that they’ve just been shaken out of, but my research indicates this type of action leads to very good results.
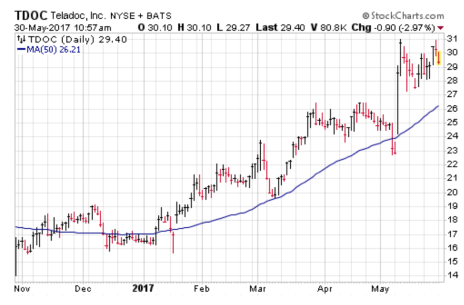
Now take a look at Teladoc (TDOC), a small-cap stock leader. Shares were in a volatile uptrend from mid-January through March, but after stalling out for a few weeks, TDOC dove below its 50-day line on heavy volume, hitting a two-month low in the process. It certainly looked like the stock’s uptrend was in trouble.
But then earnings came out and the stock exploded higher on big volume, surging to new highs. A Shake-and-Snap! TDOC has consolidated quietly since; there are no sure things but it looks like it wants to go higher.
Current Setups
To find potential low-risk stock opportunities using these patterns, I like to look for a growth stock that’s advancing persistently (for a potential Persistent Pullback) or a stock that’s under pressure close to earnings (for a potential Shake-and-Snap if earnings are well received).
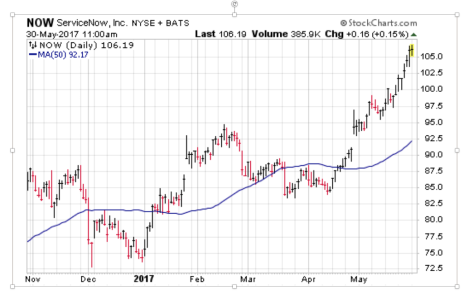
Right now, ServiceNow (NOW) is a potential Persistent Pullback setup. It’s an emerging blue chip stock in the cloud software field with exploding free cash flow, and the stock has been in an accelerated, persistent uptrend since mid-April, hitting all-time highs in the process. I love the story, and my guess is that any sort of quick shakeout or retreat of a few days would be buyable.
As for Shake-and-Snap, keep an eye on Ulta Beauty (ULTA), which has been chugging higher since a good-sized correction last year; it hit new highs near 300 in early May before quickly sinking below 280 a couple of days before earnings. But it rebounded powerfully after earnings, hitting new highs last Friday. It’s not the first inning of the stock’s overall advance (ULTA has been a good winner in recent years), but if ULTA can hold up around here, the odds are great that its uptrend will resume.
[author_ad]


