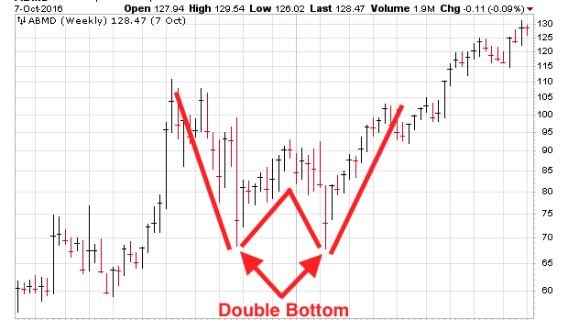
A double bottom chart pattern is used in technical stock analysis to describe the fall in price of a stock or index, followed by a rebound, then another drop to a level that’s roughly similar to the original drop, and finally another rebound. Consequently, the double bottom chart pattern resembles the letter “W.”
This “W” pattern forms when prices register two distinct market bottoms or lows on a chart. However, the definition of a true double bottom is only achieved when prices rise above the high end of the point that formed the secondary low.
Put another way, the double bottom is a “reversal pattern” in an equity price’s downward trend. The price drops to a floor—a “support level"—before rallying, pulling back up, and then falling to the support level again, before rising.
[text_ad]
How is a Double Bottom Chart Pattern Characterized?
A double bottom is characterized by two well-defined lows at roughly the same price level and are among the most commonly occurring chart patterns.
Double bottom patterns can be discerned within charts that are intra-day, daily, weekly, monthly, yearly and longer term. The two lows should be distinct. According to technical analysts or “chartists,” the second bottom can be rounded while the first should be distinct and sharp. Your broker or trading platform should offer charting tools to conduct your own analysis, however, Stockcharts.com and Tradingview.com both offer excellent alternatives.
The pattern is complete when prices rise above the highest high in the formation. The highest high is termed the confirmation point.
Typically, a double bottom’s volume is greater on the left of the bottom than on the right. Volume usually is downward as the pattern forms and accelerates as the pattern hits its lows. Volume increases again when the pattern completes, punching through the confirmation point.
What Does a Double Bottom Chart Pattern Signal?
If accurately identified, the double bottom can signal a fortunate entry point for investors.
To chartists, the double bottom chart pattern indicates that the stock has reached a crucial support level and is encountering difficulty moving lower. That implies the stock has formed a low and is now positioned for an upward move.
When Should You Buy a Double Bottom?
If you see a double bottom chart pattern, and are adept at managing short-term risk, try to buy soon after it’s identified as a potential double bottom. The return is either quick profits or a small loss as the stock falls below the false double bottom.
If you’re a savvy investor, you won’t try to buy at the bottom; instead, wait for the stock to pass the confirmation point, so you can be certain (as certain as anything on Wall Street) that the double bottom is truly past and that the uptrend is truly in effect.
Do you now understand more about double bottom chart patterns? What else would you like to know?
[author_ad]
