I felt like a man on an island for the past month, writing a few times that I actually thought the market had a very good setup in place, with lots of pessimism out there (most had already sold out) and some resilient stocks and sectors (especially on the growth side) just as the calendar was going to turn favorable (I’m not a big seasonality guy but October is a month of market bottoms)—so if something could actually go right in the world, there was a chance stocks could come to life.
Last week, I think we started that process, as interest rates (and perception of future Fed action) took a turn for the better, which prompted a very broad and powerful few up days in the market—and, this week, we’ve seen very normal action, mostly digestion in the major indexes as individual stocks act generally well.
[text_ad]
To me, this is encouraging … but is also just a first step—I put a little money to work this week, but still have a lot of cash. So, what am I waiting for, from both market-wide indicators and individual stocks? That’s the topic of today’s Wealth Daily—the handful of measures and clues beyond the trend in the indexes that will tell me whether this rally is the real deal.
4 Signs to Confirm the Stock Market Rally
#1 New Highs – In Total and Among Liquid Potential Leaders
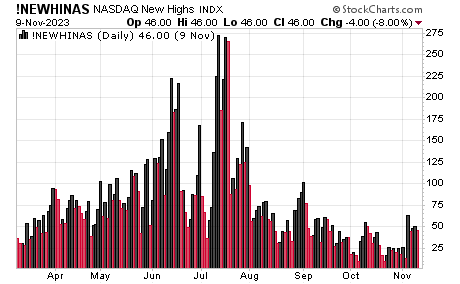
If you’ve been reading me for any length of time, you know that the hallmark of the rough 2022 and 2023 (outside of the two-month spring rally in select names) has been selling on strength—yes, there have been rallies, but when indexes or individual stocks approach resistance, they’ve run into a wall at best and have melted down at worst. That, in turn, meant the new high list has been a joke, and that was especially true in recent months, where even some brief pops in the market saw next to nothing hitting virgin turf. We don’t need to see 500 stocks hitting new highs every day, but something consistently in the triple digits would be nice confirmation we’re in a bull market.
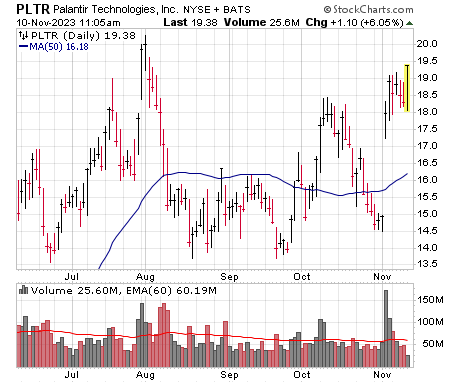
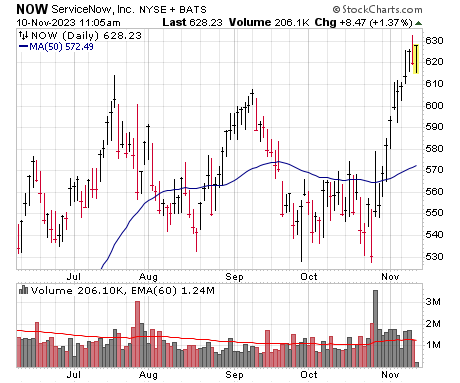
So that will be the #1 key to me in the weeks ahead, both on a market-wide basis and for individual stocks, where I like to monitor liquid growth titles for signs that institutions are willing to pile in even when a stock has had a good move. So far, it’s promising. Take a look at Palantir (PLTR), which bolted higher after earnings last week—it’s in an area of resistance and is holding so far ... but further strength after a little digestion would be better. There’s also ServiceNow (NOW), which, while a bit more mature these days, has raced higher on a great volume cluster (more on that below) and has refused to pull in at all despite testing its old highs.
So far, I like what I see, but I really want to see PLTR, NOW and many others (SNPS, DKNG, AXON, etc.) continue to new highs going ahead.
#2 Volume Clue Support (VCS) on Dips
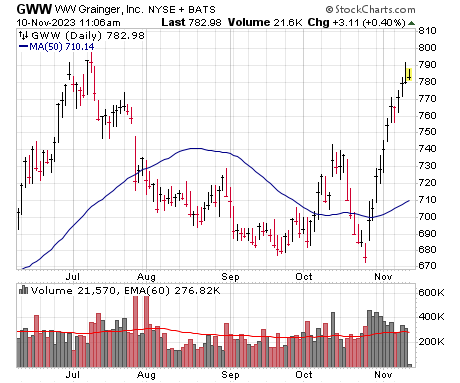
“But Mike, many of these stocks have just had big moves—wouldn’t it be fine if they pulled back and digested those moves?” It would, but a lot would depend on how these things digest, which leads me to volume clue support (VCS)—that simply refers to a stock that’s run up a few days in a row on big volume, depicting a string of accumulation by big investors. Thus, if the stock pulls back soon after, there “should” be a bunch of big investors that pick up more shares on dips (the theory being it’s unlikely all the institutions got all the shares they wanted on the few up days).
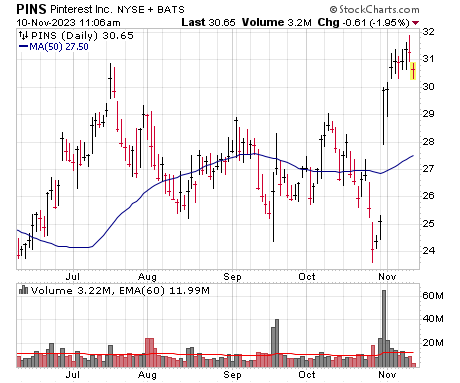
Thus, whether it’s an older school name like WW Grainger (GWW), a cyclical like Pulte Homes (PHM) or a turnaround growth title like Pinterest (PINS), I want to see pullbacks be tame and controlled if they come. Again, so far, what I see is encouraging, but if a few of these begin to give up the ghost and names near new highs do the same, it would be a sign that big investors aren’t believers.
#3 Interest Rates
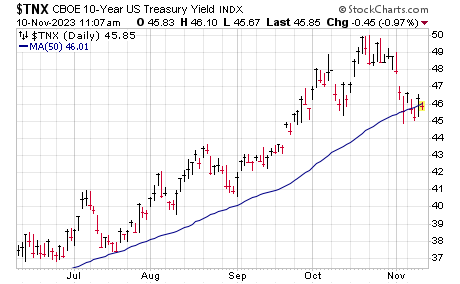
I like to keep things simple in the market, and the fact is that interest rates (and perception about future Fed policy) have been the tail that’s wagged the dog for the past two years. So it’s pretty simple: If Treasury rates can stay down (or fall further) after last week’s dip, it should support stocks—if, however, the uptrend resumes, it wouldn’t be good. What I’d really like to see is the yield on both the five- and 10-year notes (shown below) decisive drop below their 50-day lines and stay there—the five-year is off to a good start on that front.
#4 “Granddaddy” Blastoff Indicators Would be a Plus
Probably in part because of the rapid rise in rates, the broad market has been the “leader” of the downside in the market—while big-cap weighted indexes have done OK, small and mid-caps (and even equal-weighted big-cap indexes) have not. That’s one reason why last week’s surge was so encouraging—it wasn’t just Apple (AAPL) or Microsoft (MSFT) but the broad market that whooshed higher as well.
In fact, the rally was so broad that one old indicator did flash—known as the Zweig Breadth Thrust (invented by Marty Zweig, a great investor), it effectively measures when the NYSE advance-decline line goes from very oversold to very overbought within a two-week span. It’s very rare, but going back to 1970, the S&P has been higher six months (by 17% on average) and a year later (by 24%) every time.
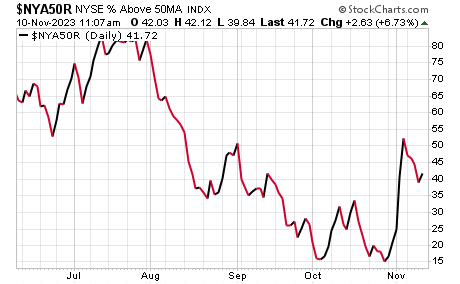
As with everything else, though, what I really want to see is follow through—and possibly another “granddaddy” blastoff indicator to flash. The one I’m watching is the 90% Blastoff Indicator, which would occur if 90% of NYSE stocks close a day above their respective 50-day lines.
That obviously takes a lot of strength to build up, though historically, pullbacks after a 90% signal have been minor, and in this case, such a run would go a long way toward telling us the two-year slog in the market is transitioning to a bullish phase.
[author_ad]

