The two-year versus 10-year yield curve inverted briefly on Tuesday, driving investor concerns about a looming recession. What does it mean for the broad market? And more specifically, for small-cap stocks?
The answer to these questions might lie in data recently released by Bank of America Global Research.
But before we get to that let’s define exactly what a yield curve inversion is.
[text_ad]
A yield curve inversion occurs when short-dated Treasuries pay higher yields than longer-dated bonds. You can pick different parts of the curve (for example, the five-year versus 30-year) but most market observers focus on the gap between two- and 10-year yields.
An inverted yield curve – when the two-year yields more than the 10-year – is not a great sign. Under normal circumstances investors want more yield if they are to tie up capital for longer. This helps compensate for the risk of inflation, rate hikes, etc.
When the yield curve inverts that logic goes out the window.
Yield curve inversions have proven to be one of the best predictors of a coming recession, preceding 10 out of the last 13 such scenarios.
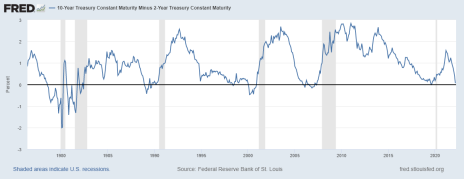
This relationship is clearly seen in the following chart from the St. Louis Fed. Note how recessions (shaded areas) tended to follow when the spread between the two-year and 10-year went negative (i.e. below zero).
As of Wednesday morning the spread was 0.06%. This follows a very brief inversion Tuesday that lasted just a few minutes. With the yield curve right on the cusp of another inversion this relationship will likely be top of mind for a while.
What does a yield curve inversion mean for the broad market?
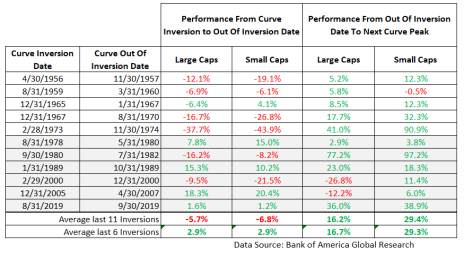
In the last 11 inversions (dating back to 1956) large caps have fallen by an average of -5.7% between the time when the yield curve inverted and when it came out of inversion.
There is a potential silver lining, however. Large caps were up in four of the last six examples, rising by an average of 2.9%.
Why? It is possible that policymakers have become better at navigating the U.S. economy through less-than-ideal circumstances, including recessions.
What does a yield curve inversion mean for small-cap stocks?
Small caps tend to outperform large caps over the long term. However, they too have tended to struggle when the yield curve inverts.
In the last 11 inversions small caps have fallen by an average of -6.8% between the time when the yield curve inverted and when it came out of inversion.
That said, small-cap stocks were also positive in four of the last six inversion periods and posted an average gain of 2.9% over all six examples.
What about coming out of inversion?
The data shows both large- and small-cap stocks tend to do very well coming out of inversions. Over the last 11 inversion exits large caps were up by an average of 16.2% by the time the yield curve peaked.
Small caps were up by an average of 29.3%, almost twice as much as large caps.
Here is the data for all these scenarios.
What are the caveats?
As always there are different circumstances each time the yield curve inverts, including how long it takes to exit inversion. It’s one thing if stocks are down for 10 months, as happened in 2000. But it’s another thing if they’re down for almost three years, as was the case in 1967-70.
It’s beyond the scope of today to go into all the variables. But at a high level, influencing factors include GDP, unemployment, interest rates and macro environment in the period leading up to, and subsequent to, a yield curve inversion.
This time around interest rates are very low and inflation is very high. So the Fed doesn’t have any room to slash rates should the economy start to slow down too much.
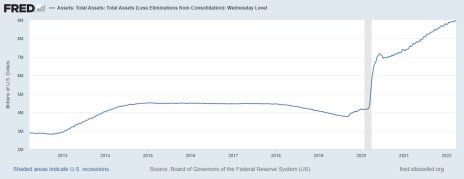
Also, the Fed’s balance sheet is at a record high (see the 10-year chart below) of nearly $9 trillion. The importance of this can’t be overstated as the Fed’s balance sheet strategy will have an impact on interest rates, and thus the yield curve, as we move deeper into 2022.
Should the Fed take steps to reduce the size of its balance sheet interest rates should go up as liquidity is pulled out of the financial system. This could also help rein in inflation as there would be less money chasing goods.
The Bottom Line
The bottom line is that both large caps and small caps have tended to struggle when the yield curve inverts again.
But in more recent history there are plenty of examples when both asset classes posted positive returns. And after emerging from inversions both have tended to do well, with small-cap stocks doing extremely well.
Still, there is no single predictor of what will happen in the market should the yield curve invert. There are just too many influencing factors.
Based on the evidence in front of us right now I wouldn’t be overly concerned on day one of a yield curve inversion. Rather, I’d keep an eye on the rate of change in the yield curve in the context of the Fed’s statements (and actions) on interest rates, balance sheet strategy, unemployment, macro environment and inflation.
It’s all intertwined and it’s the sum of the different parts that will determine how large- and small-cap stocks will perform now that the yield curve is dancing with inversion.
[author_ad]


