So, first and foremost, I’m doing a market outlook webinar on Thursday, January 18, and we’re charging the very reasonable price of (checks notes) FREE to attend or to sign up and get the recording later on—I’ll have an in-depth view of what I see in 2024 and, of course, some stocks that I think can remain under accumulation. You can sign up here.
Because I’ll be presenting a bunch of intermediate- to longer-term stuff in two weeks, I’ll save the big-picture market stuff for later this month. Right now I want to focus on what I wrote in the last week of 2023 (yes, I was actually working) and what we’ve seen in the new year selloff this week: That January as a whole (and early January in particular) is often very tricky due to myriad crosscurrents out there, including tax-related profit taking, re-positioning among big investors like hedge funds, big industry conferences (which often bring lots of 2024 guidance) and, in the second half of the month, earnings season (and the positioning that goes on ahead of it).
And we’ve certainly seen that so far, with the strong areas of the market getting walloped so far this year—most of that is growth stocks, but we’re really seeing just about any stock that had a good run get hit. Meanwhile, there has been some rotation into lagging defensive-oriented names as well.
As always, I have a few thoughts, which I’ll share here.
[text_ad]
My 5 Instant Reactions to the New Year Selloff
First, short term, excellent technician Wayne Whaley (@WayneWhaley1136 on X, formerly known as Twitter), did a study where the Nasdaq fell at least 0.5% on the first day of the year following a double-digit gain the prior year—and a week later, the index was higher every time by an average of 2.3%. To be clear, I’m not that short term, and we’re already well into that five-day stretch, but it does show you that early-year weakness is often reversed. We’ll see.
Second, as I wrote in last week’s Cabot Growth Investor, there has been an avalanche of “hyper-overbought” readings in the market—which, ironically, suggest higher prices down the road. There have been a bunch, but one is that 90% of stocks in the S&P 1500 (small, mid and large caps combined) closed north of their 50-day lines on December 19. Six months later, the S&P 500’s average max gain was around 16%, while the max loss was less than 2%. My point: There are no guarantees, but the super-strength seen in November and December *should* lead to higher prices down the road—so any correction should give way to a renewed rally. We’ll see.
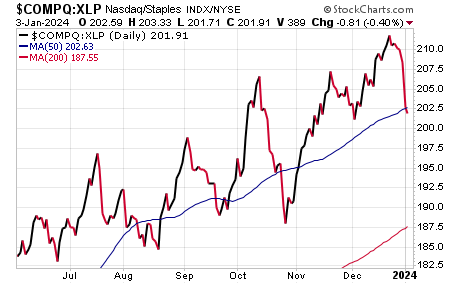
Third, if you are looking for a key piece of evidence to worry about, I would point to our Aggression Index, which simply measures the performance of the Nasdaq (growth) vs. the Consumer Staples Fund (XLP). Big picture, it’s OK, but the Index is at key levels, having dipped below its 50-day line here … not out of character in recent months, but you’d like to see the sharp decline reverse. Even if the overall market finds a low, if this continues to fade it could point more to a “risk-off” situation.
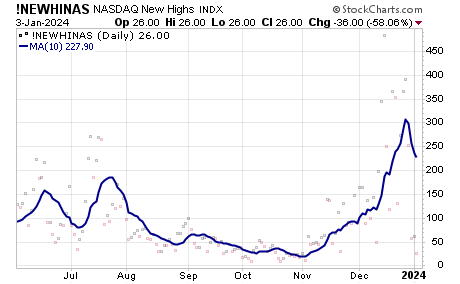
Fourth, assuming you’re leaning bullish but are wondering when the near-term sentiment might get dour enough, check out the new high list—normally, it’s a good contrary short-term indicator. Shown here is the chart of the number of Nasdaq new highs along with the 10-day moving average—it’s starting to scream lower but is still elevated. It’s a secondary measure, but seeing this back toward the 100 to 125 area (near where it was at the start of December) would be a sign some steam has come out of things.
Fifth: When it comes to individual stocks, so far, I’m seeing a lot of damage—but not a lot of breakdowns … and I’m also seeing some other names start to emerge. What I like to do when things hit a major air pocket is simply compare stocks to each other, and to the market itself—finding relative strength, even on a short-term basis, can be valuable.
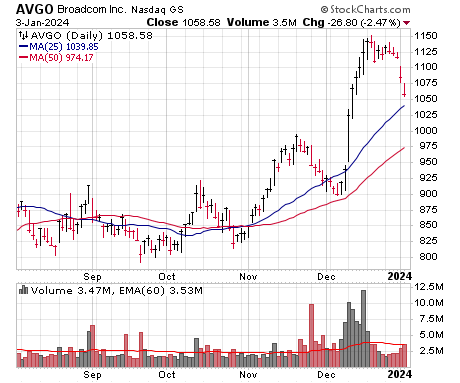
For growth stocks, we see the Nasdaq has sunk to (a) a bit below its 25-day line and (b) is still a percent or so above its July high. So, ideally, we’re looking for titles that are in better shape. One (admittedly super high-priced) idea is Broadcom (AVGO), which went bananas on gigantic volume in the first half of December, and while it’s slipped, it remains north of its 25-day line and way above its summer highs.
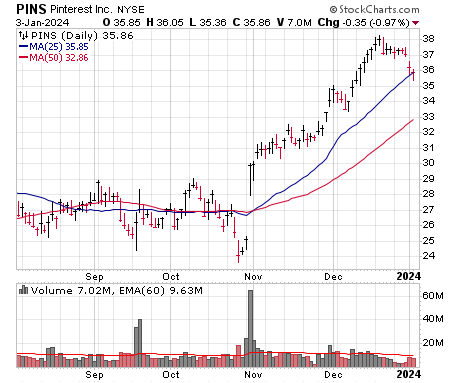
Another one: Pinterest (PINS), which gapped up on earnings just as the market got going and had a beautiful run. While it’s testing its 25-day line along with the market, it’s in much better shape overall, including compared to its prior high.
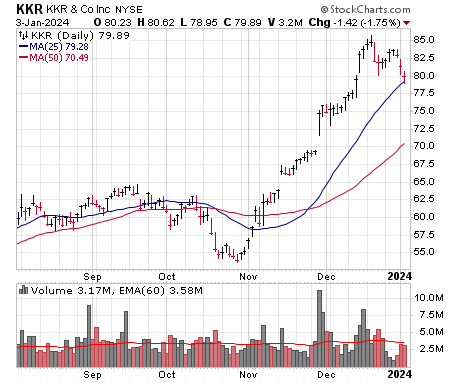
And outside of traditional technology or Internet: Check out KKR (KKR), a private-equity-heavy play (I refer to it and its peers as Bull Market stocks) that had a huge run out of its bottoming area and has finally begun to digest—again, still north of its 25-day line as I write this and miles above where it was in the summer.
As I mentioned up top, these are just a few of my immediate thoughts about the new year selloff we’re seeing. For my full 2024 outlook, sign up for the upcoming webinar.
[author_ad]

