I was speaking with an acquaintance this week who ventured his opinion that U.S. stock markets are very high. He looked extraordinarily dismal, even fearful. Are he and I witnessing the same stock market?
Because here are a few industries that are nowhere near “high”: agricultural chemical stocks, airline stocks, apparel stocks, large-cap bank stocks, department store stocks, pharmaceutical stocks, steel stocks and the entire energy sector. So what exactly was this guy worried about?
[text_ad]
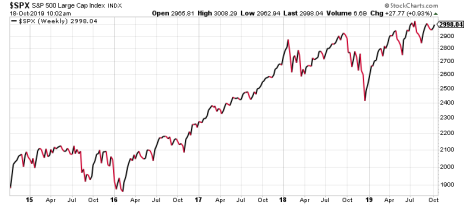
Fortunately, I had my computer in front of us, and I was able to show him the same thing I’m showing you on this price chart of the S&P 500 index (SPX).
Look at the stock market run-up from the February 2016 low to the January 2018 peak. The SPX rose 57% during that time. In terms of long-term stock market performance, this two-year time period was an anomaly, an exaggerated run-up worthy of a place on the far right side of the performance Bell Curve. In reality, the average annual return of the S&P 500 index over a 30-year period through September 2019, including reinvested dividends, was 9.7% per year. In comparison, the stock market performed extremely well in 2016 and 2017!
Next, look at the time period between the January 2018 peak and today (I’m writing this on October 17), which spans 21 months. The S&P 500 index is at 2,994. That means during this 21-month time period, the SPX rose from 2,873 to 2,994. That’s a 4.2% total increase—a low number that lands near the left side of the Bell Curve, and just slightly better than bank savings account returns for the same time period.
What’s the lesson here? As one might guess, stronger-than-average performance is eventually offset by weaker-than-average performance, whether we’re measuring stock market results or hurricane frequency data or annual inches of snowfall in Minnesota. Keep in mind that my fearful acquaintance was referring to 2018 and/or 2019 stock performance as he expressed his opinion that the stock market was “high.”
So which is it? Has the stock market stagnated for 21 months, or is it “high”? It can’t be both things simultaneously. Maybe this guy has only been paying attention to a couple of high-P/E growth stocks that raced upward this year, then fell dramatically, and he’s assuming that the rest of the market performed in synch with his focus list. But as far as the broader market is concerned, I’d say it hasn’t been unnaturally “high” since January 2018.
Due for Another Stock Market Run-Up
It’s worth mentioning that the stock market is composed of mostly-successful companies, and that as these companies’ values grow (represented by their assets, competitive advantages and rising profits), it’s natural and expected that their share prices grow as well. Companies within the S&P 500 index that are floundering will eventually be removed from the index, replaced by growing, thriving companies. Therefore, the stock market is supposed to rise as the years go by. It would be weird and unnatural for market indexes to stagnate for very long, or to fall and remain depressed.
There are probably people who don’t know that stock prices represent something real that has value, and for those people, the stock market probably seems like it’s controlled by voodoo. However, stocks represent ownership of companies. When you own 100 shares of Apple Inc. (AAPL), you own a little piece of the company. If the company grows, your share price is probably going to grow over a multi-year period.
We all know that over the short term – a few days, weeks or months – stocks can bounce all over the place. But give them a few years, and suddenly you’ll be visualizing a new boat, your daughter graduating from college, or a comfortable retirement.
The S&P 500 index has had plenty of time to correct and stabilize after the huge 2016-2017 stock market run-up. I’m not going too far out on a limb in saying that the stock market could begin a new run-up into all-time high territory this month. I’m bullish, and I’m excited for what I believe will be a very nice market move. And lest you think I’m always bullish, here’s what I wrote to subscribers of Cabot Undervalued Stocks Advisor in January 2018, a few weeks before the market peaked, then fell 10%:
“At some point in the coming months, I expect a price correction in U.S. stock markets. …markets don’t generally climb and climb and climb without periodically adjusting. We’re overdue for that adjustment. Make sure you have cash set aside with which to buy low!”
And there you have it. I’m very bullish today, but always willing to reassess markets as they change. Stay invested. Your future is at stake.
[author_ad]


