Stock Market Video The Three Monsters Under Growth Investors’ Beds
In Case of Doubt Sound Convincing
Can Anyone Predict the Market?
Think in Terms of Probability
On the Right Side Enough of the Time
---
Can anyone predict what the market will do? Not really. Not with precision, anyway, and not within the normal meaning of “predict.”
If I say, “I predict the market will be up next month,” I cannot possibly mean that I know the precise path some index will follow over the next 21 trading days. Heck, I can’t reasonably even say what the path will be as it moves through the trading day tomorrow.
What’s meant in that prediction—what it has to mean—is that the probability of advance is something greater than 50-50. And it might even mean the advance will be bigger than usual. And you can probably further infer that the coming month’s advance will probably be no greater than (say) 20%, because if I thought the coming month would be that strong, I’d surely have said so.
So if I simply say, ”I predict the market will be up next month,” I’m likely suggesting that prices will probably advance by at least 1% and no more than 20%.
(Actually, I never say, “I predict the market will be up next month,” because I never know quite that much. But I’ll get to that below.)
If I believe the market (say the S&P 500) is more likely than not to rise between 1% and 20% in the next 21 trading days, I’m implicitly leaving some probability the index will end up outside that range. Maybe if you pin me down, I’m estimating the index has a 45% probability of falling, a 50% probability of rising in the 1%-to-20% range, and a 5% probability of gaining more than 20%. Or something like that.
You can see where this is heading. My so-called “prediction” is actually an expectation about a distribution of possible returns. And once we recognize it as a distribution, it’s almost impossible to know—even after the month is over—whether the expectation turned out right or wrong.
If instead of the simple “up” prediction, I had explicitly offered the 45%, 50% and 5% probability ranges, then whatever the outcome, it would simply be one outcome that would automatically (and always) turn out somewhere in one of those ranges. Not right/not wrong … just one observation among all the possibilities.
Testing outcome distributions mathematically is complicated, and I’m not suggesting most folks should literally be doing the math. Statistics are my stock-in-trade, so I have developed models to do the math. But most of the time that’s not necessary.
What every investor can do is begin thinking in terms of probability distributions. When you read some analyst’s prediction or projection, ask yourself what does that analyst think is the likely range above and below it. If that range is too huge, that analyst isn’t telling you much; if it’s really small (narrow target), it’s unrealistic.
Do it with your own expectations, too. When you form your own outlook for a stock or the market, ask yourself about the likely range of possibilities … or even try actually defining a distribution with assigned probabilities. (Make it add up to 100%, to be sure you’ve included the “far out” possibilities). Then ask yourself whether you really know what you thought you knew; does your distribution range make sense relative to actual history you’re familiar with?
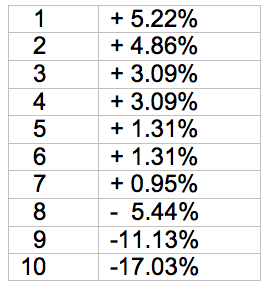
Barron’s recently had a story covering 10 strategists’ market outlooks for the rest of the year. Each strategist set “targets” for the S&P 500 at year-end, four months out. (They also set targets for earnings, GDP and interest rates.) Here is a tabulation of percent changes for their S&P projections, from biggest gain to biggest loss.
Most of these strategists’ projections aren’t really telling us much. That’s because the long-term average four-month return for the S&P is about 3¼%, with a statistical “probable error” of 7%. (“Probable error” means half the time the actual four-month outcome is within 7% of the long-term average and half the time it’s more than 7% away from the average.)
So eight of the strategists are projecting the next four months to be unremarkable (within the +/- 7% probable range from long-term average). That’s not zero information, but it’s not much. Only the two most bearish strategists are “virtually certain” of the four-month direction (down).
---
I hold no expectation that strategists will begin to offer expected ranges or probabilities anytime soon, nor that stock analysts will offer expected distributions with their stock price targets. So we’re saved from doing the math (yay!), but missing important information (boo!).
But that doesn’t stop us from thinking about the ranges, and it shouldn’t stop you either. Consider the likely range of possibilities—theirs, or yours—and assess your own confidence in a successful outcome. When we’re really candid with ourselves, we usually find an awful lot of our “predictions” have less substance (more variance) than we would want to bet on.
For myself, I never set predicted targets. (Well, almost never.) I don’t believe I know that much. I find it’s enough (and plenty tough) just to know which way the wind is blowing for now. And even then, I have to realize that the direction is uncertain. There are gusts and eddies that can be deceiving.
But by betting with the way the wind blows now, and always watching that weathervane for changes, I can be on the right side of things enough of the time to do well.
Your guide to ETF investing,
Robin L. Carpenter
