In today’s world, 26 months can seem like a lifetime. For instance, 26 months ago, Barack Obama was still president, “Brexit” was not yet part of the vernacular, Bitcoin was worth less than $400, and a barrel of oil cost just $27. But in reality, 26 months isn’t that long. Garth Brooks tours last longer. So making a stock market comparison between just over two years ago and now isn’t like comparing the Jurassic period to the Cretaceous period.
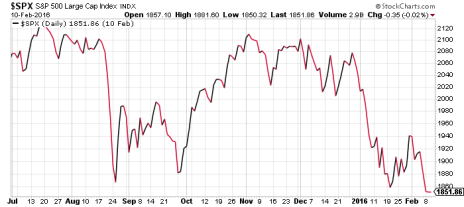
What’s so special about what was happening in the stock market 26 months ago? The S&P 500 was hitting its lowest point since early 2014, bottoming out at 1,851 after a seven-month retreat. The market correction happened in two phases: first, in August 2015, after stocks had touched new all-time highs in late July, then again in December and January, after U.S. stocks had recovered most of their losses, only to go plummeting back to even lower depths.
[text_ad use_post='129622']
Here’s what that double-dip correction looked like on a chart:
All told, the S&P 500 declined more than 13%. The worst of it came in two big swoops: an 11% nosedive in mid-to-late August, and a 10.5% collapse in the first three weeks of 2016. Sound familiar?
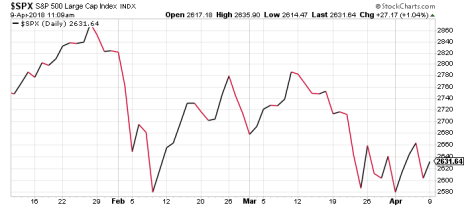
Here’s what a chart of the S&P 500 over the last three months looks like:
After topping out at 2,872 on January 26, the S&P cratered over the next two weeks, falling just over 10% to 2,581. Then, having recovered the majority of those losses by the second week of March, stocks tumbled right back to 2,581 due to lingering volatility and the escalating trade war between China and the U.S.
A Better Stock Market Comparison
It’s not an exact stock market comparison. The 2015-2016 pullback was over the course of seven months, and was a bit steeper on a percentage basis. A more accurate parallel to what’s happening now might be the mini-recovery in late August and early September of 2015 before another sharp drop-off in late September. If this correction were to follow the same pattern, we might recover nearly all of the February and March losses before summer begins, then experience another quick-and-dirty crash before fall.
That said, the conditions leading up to the 2015-16 market collapse and the current one were very different. The former came on the heels of a frustratingly long period of churn, with stocks moving sideways for the better part of a year. The current correction comes on the heels of one of the most prosperous, angst-free years for stocks in recent memory.
Thus, a more apt stock market comparison, perhaps, is 2004, as our resident market historian and chief analyst of Cabot Growth Investor and Cabot Top Ten Trader Mike Cintolo wrote last week. After a monster, post-dot-com-bubble bursting recovery in 2003, stocks retreated in the first half of 2004, with the Nasdaq tumbling 18% from the middle of January to the first week of August. A similar scenario played in the first half of 2010, after the post-recession recovery of 2009.
As in 2015-16, each correction served as little more than a multi-month pause button on what is now a nine-year bull market. Within months of bottoming out, stocks were up to new all-time highs.
Will that be the case again this time? Recent history is encouraging. But as Mike said, it may take “another month or two of cooling off.” Here’s hoping that as the weather heats up, so will stocks.
To know when to get back into the stock market and which stocks to buy, consider taking a trial subscription to Cabot Growth Investor by clicking here.
[author_ad]


