Today, I want to talk about something that’s been on many pundits’ minds of late: the inverted yield curve. But first, let’s talk about what’s going on in the market right now.
One of the hardest things for even experienced investors to keep in mind is that the market is a contrary animal—it doesn’t act the way “common logic” would often suggest. The reasons for this are many (including that the market is a discounting mechanism, talked about below), but the point is that the market’s moves often defy common logic and, in fact, sometimes do the opposite of what makes sense.
One of my favorite examples of the market’s weird behavior has to do with its annual returns. Looking back at the last 89 years (since 1928), the average return including dividends (just adding up each year and then dividing by 89) for the S&P 500 came out to be about 12%. Knowing this, it would make sense that most years would probably come in plus or minus 10% from that average—say between 2% and 22%. Seems reasonable, right?
Wrong! It turns out, about two-thirds of all years had returns outside of that band—i.e., either less than +2% or greater than +22%. Just one-third of years fell into the “normal” range of returns! In other words, what most investors think is unusual actually is the norm in the stock market.
[text_ad]
The market’s trickery doesn’t just extend to yearly returns; it also has a way of acting that throws many off its scent. (One famous investor used to say that the market does the most obvious thing in the most unobvious way possible.) A good example here is the yield curve, which has become a popular topic in the financial media recently as spreads have tightened.
What the Inverted Yield Curve Really Means
It’s true that an inverted yield curve (when short-term notes yield more than longer-term debt) is a fairly reliable sign of an upcoming bear market and recession—I even wrote about that fact earlier this year. Thus, as the curve has tightened, a bunch of investors are starting to think a bear market or recession is around the corner.
However, the authors of these articles are forgetting two things. First, the curve hasn’t actually inverted yet, and there’s no guarantee it will anytime soon. And second, according to Ryan Detrick of LPL Financial, even after the yield curve inverts, the market tends to do well for a while!
According to Detrick, the last five times there was an inverted yield curve, it took 21 months on average for a recession to start, and the S&P 500 advanced 13% during that time. And some instances (like those in 1988, 1998 and 2006) saw the market rally 22% to 39% before topping out!
Said another way, the obvious rarely works in the market—and if it does, it usually works in a way most don’t anticipate.
That’s something to keep in mind as everyone shares their opinions about the “trade war” going on between the U.S. and China. I’m thankfully not an economist, so I’ll let others debate what the various tariffs (which, to this point, apply to a relatively small amount of goods) will do to the U.S. economy and stock market.
But my biggest thought is that trouble often comes from where investors least expect it. Given that the tariff news/rumors are coming at a rapid pace, it’s likely that the consensus view of the trade war (tariffs = bad) won’t play out in the stock market as expected.
Long story short, if you want to time the market, the best thing to watch is … the market itself! Cabot Growth Investor has a long history of doing just that, with our trend-following market timing indicators keeping us out of major downturns and in major bull moves. Along with our stock selection methods, it’s one of the big reasons our Model Portfolio has nearly doubled the S&P 500’s return during the past 11-plus years! To learn more, click here.
Back to the here and now, the market did a very nice job of holding support during its late June selloff and rebounding in the days since. In the very short term, the major indexes leapt back to their June highs in a straight line, and the number of stocks hitting new highs has shrunk from its June nadir. Throw in the fact that earnings season is set to get underway and a pause or pullback wouldn’t be unusual.
Still, with most of the evidence in the bullish camp, I’m also a bull, though picking your spots makes sense; my guess is the environment will remain tricky and challenging going forward. One of the screens I’m looking at for new buying includes the following factors:
- Great fundamental growth (naturally)
- An early-stage breakout during the May/June timeframe and some solid follow-through after that breakout
- A reasonable pullback during the market’s June/early July hiccup
- And then either a quick snapback to new highs, or, if there wasn’t much of a retreat, some tightness near its highs
This Stock Meets My Criteria
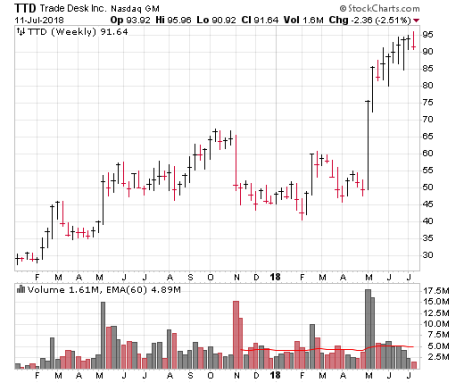
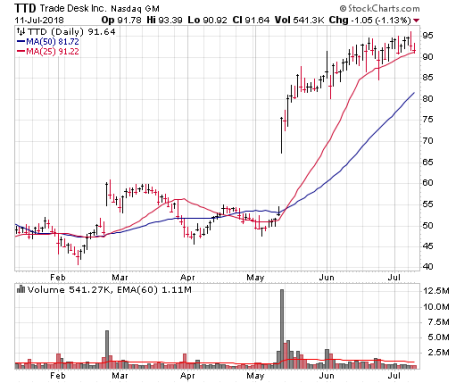
A good example of the behavior described above is Trade Desk (TTD), featured in Cabot Growth Investor, which is leading the way in programmatic advertising, which looks to be where the advertising industry is headed. Let’s go step by step.
- Trade Desk has been expanding at a good clip, with revenues up 50%, 42% and 61% during the past three quarters, while earnings have been ripping ahead at a faster clip, up 89% in the latest quarter.
- TTD began a big base starting last October that lasted right through April, before a blowout Q1 report caused a monstrous reaction—shares blasted off for two straight weeks on gargantuan trading volume.
3. TTD’s pullback was certainly more than reasonable; in fact, looking at the chart, you wouldn’t be able to tell that the market hit a pothole at all!
4. And now we see that TTD is trading fairly tightly right around its highs. In fact, on the weekly chart, the stock has been crawling higher since the blastoff, a sign of accumulation.
Obviously, with earnings coming up in a few weeks (likely early August), TTD has some risk. And if the market has another quick retreat, TTD could go along for the ride this time. But the action here suggests the stock wants to go higher should the market’s rally continue. It’s definitely one to watch if you don’t own it, and a big-volume move higher could be the clue that the buyers are showing their hand.
In my Cabot Growth Investor investment advisory, I look for stocks like Trade Desk - stocks that check all my boxes. This week, we added two new stocks to our portfolio. To find out which stocks I added, and to get my full list of recommendations, click here now.
[author_ad]


