Is it Possible to Time the Market? You Bet!
Back in the good old days of 1999 and 2000, when I first came to Cabot, I had the opportunity to study and back-test a variety of market timing systems. We had our own market timing indicators, but the system had lost value in the late 1990s bull market. Who needed a market timing indicator when stocks went up every year?
Obviously, the 2000s changed that thinking. I was interested in market timing, so I studied what seems like 100 different systems, many of them factoring in sentiment, fundamentals, money supply and/or the calendar. Some were OK, but I noticed all of them would work well for a couple of years, then not work at all, then work well, etc. None of them really wowed me.
That was a real bummer—spending countless hours studying and back testing to come up with nothing. With my head swimming, I took a step back and thought, “Why not simplify some things and see if it worked better?” And it did!
[text_ad]
In Cabot Growth Investor, we’ve always had a version of what we call our Cabot Trend Lines, which is our primary longer-term market timing indicator. Back when I started, the Trend Lines were based on the Dow Industrials and Dow Transports. That seemed a bit outdated to me—our growth stocks didn’t correlate to either index—so I updated the system.
And it’s the best long-term market timing indicator I know of!
It’s super simple. Without giving away all the details, the Cabot Trend Lines now look at the market’s two major indexes (S&P 500 and Nasdaq Composite) and compare each to a longer-term moving average. That’s it. Just pure trend-following, without factoring in the news, the U.S. dollar, sentiment, the calendar, volume or anything else.
And how has it done?
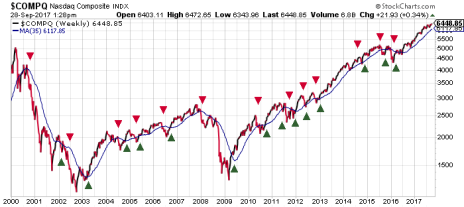
Since October 2000, it’s given a total of 26 buy or sell signals, about 1.5 per year. (In half the years, it’s given no signal or one signal.) If you bought the market at every buy signal and went to cash at every sell signal, you’d be up 156% since then, while the Nasdaq is up just 64% over that time. Plus, you would’ve avoided the stress and heartache of the two major bear markets during that time. (Red triangles, sell signal; green triangles, buy signal.)
Cabot Trend Lines are able to outperform simply because, as a trend-following market timing indicator, it’s guaranteed never to miss a major market rally, and it’s guaranteed never to stay invested during a major decline. Sure, there is the occasional whipsaw signal, which is never fun. But that’s more than made up for by the long-lasting trends in the market.
Our Cabot Trend Lines are currently bullish. But more important to me is that they turned positive early last April and have remained bullish ever since—right through Brexit and the election uncertainty. Today, they continue to tell me that the odds favor higher prices in the months ahead, though I’ll certainly let my subscribers know when that changes.
I spend most of my time hunting for big winning stocks, but even the best stocks will get smashed during a prolonged market decline. Having the Cabot Trend Lines at my back gives me the confidence to know when it’s a bull market and, more important, when a potential big decline is getting underway!
Our Market Timing Indicator Readings Today
The current market environment is a bit crazy, but that’s normal for early January, when so many big investors (especially hedge funds) reposition and rotate their portfolios. It’s a tricky time of year, and we’ve seen that during the first two weeks of this year, with some beaten-down growth stocks like Facebook (FB) and Amazon (AMZN) bouncing, while post-election winners like financials and materials stocks continue to consolidate tightly.
One result of that is that the market appears to be narrowing a bit. For instance, when the S&P 500 ripped to new highs in early December, a whopping 124 stocks in that index hit 52-week highs. Last week, when the S&P nosed out to new highs, that figure was 29. Throw in some signs of investor complacency (60% of investment advisories are now bullish, which is often a yellow flag) and with earnings season around the corner, and you certainly have the potential for the sellers to fire off a few shots.
But, as I wrote above, I like to keep it simple. And when I look at the rubber-meets-the-road indicators, I see the intermediate- and longer-term trends are up, and the fact is that few stocks have suffered abnormal selling in recent weeks. It’s probably best to be a bit more discerning on the buy side, but I remain bullish.
Yelp: Huge Potential in Local Online Advertising
One growth stock that’s been base building but is starting to find life is Yelp (YELP), which I touched on in last week’s issue of Cabot Growth Investor. Here’s what I wrote.
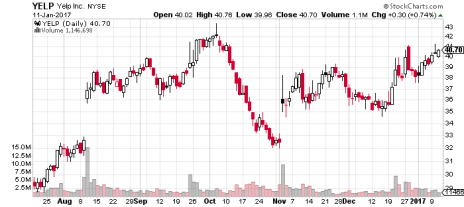
“Yelp began life as a kind of interactive Yellow Pages, connecting local businesses with interested consumers. But the company’s platform is now used internationally for interacting with customers, including downloadable content and social networking. Despite years of enthusiastic investor support, YELP slipped lower during most of 2014 and 2015, right through February 2016. The stock started its rebound last February (supported by 30% revenue growth in each of the first three quarters of 2016), rallying from 15 to 43 in October 2016. Since then, YELP has been building a normal base with support at 35 and resistance at 40. We still like this story, and a big breakout would be bullish.”
“My main thought here is that fears of competition, which are what drove the stock down in 2014 and 2015, are now dissipating. Yes, there are challengers, but Yelp remains the company best positioned to benefit from the explosion in online local advertising—in fact, revenue growth has remained strong and margins are expanding.
“And here’s the YELP stock chart:
“After a 14-week, 26% deep consolidation, YELP is strengthening, and I’d love to see a decisive breakout (maybe on earnings, which are likely out in early February) to tell me the next upmove has begun. It’s certainly worth watching.”
For more updates on this stock or additional stocks which I follow, consider taking a risk-free trial subscription to Cabot Growth Investor.
[author_ad use_author=“125412”]


