The markets are in the midst of a choppy correction and many investors are sitting on a lot of cash waiting for a new uptrend. But before we get there, let’s talk about how to handle the next leg up and how to set trailing stops on those winners so that you leave yourself open to further gains … but are still able to protect most of the gains you make.
Broadly speaking, the topic of selling is one of the most challenging in the market. Nobody has all the answers, and you’re never going sell perfectly. But I figured now was a good time to review a few pointers/opinions when it comes to setting trailing stops.
[text_ad]
How to Use Trailing Stops: The Do’s and Don’ts
First, you should decide whether to set in-the-market stop-loss orders (a bit shorter-term, and opens you up to getting knocked out on a false move intraday, but it also gets you out quickly during a meltdown) or whether to use at-the-close mental stops (longer-term, and they let you withstand a few more wobbles, but can be slow to get you out when the selling gets fierce). Neither is better or worse, but it’s usually best to pick one and be consistent.
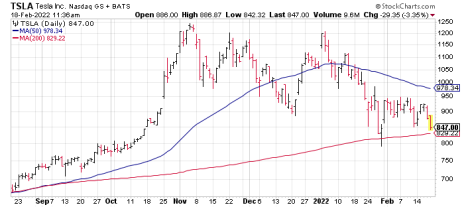
Onto tactics, I think the “worst” mental stop method (it’s better than nothing, but you can do better) is a blanket trailing stop percentage for all your stocks—i.e., you tell your broker to sell any stock that falls 15% off its high, etc. The problem with this is that one size doesn’t fit all—a 15% drop in, say, Tesla (TSLA), would be totally normal. In fact, as you can see by the chart below, a 30% drop from November’s all-time high has still not broken the stock’s long-term uptrend. Meanwhile, a 15% drop for another stock could be completely abnormal, eating into most of its gains.
If you’re going to trail a mechanical stop, a better method is to use a dynamic, chart-based method. The obvious line in the sand here is the 50-day line, which usually contains intermediate-term advances; I’ve often said that just using this simple tool probably puts you ahead of 70% of investors when making sell decisions.
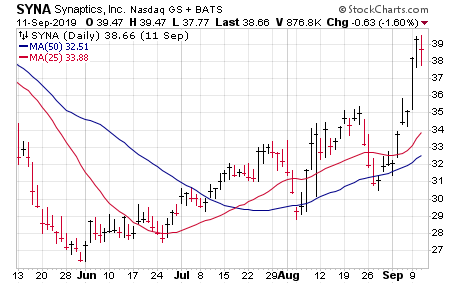
The trick here is to realize that the 50-day line is fairly obvious, and the moving average is a fence that can be leaned upon, not a brick wall (see Synaptics (SYNA) from 2019). Thus, if you use the 50-day line, try to give it a bit of leeway.
Personally, what I like to use and think works best is a slightly more advanced (and nuanced) method I call “tight to loose.” As you’d expect, it involves a relatively tight (usually 8% to 12%) initial loss limit, but then, as the stock works in your favor, you tend to loosen it up a bit—protecting profits, but also using your profit cushion to your advantage by giving the stock more room to maneuver. The method is often (not always) combined with taking partial profits on the way up—not too aggressively, but letting go of a portion of your shares (one-third or thereabouts) on the way up can book some profit but still give you exposure to plenty of upside.
There are also some signposts on the way up—the mental stop should be raised to breakeven if you’re up a healthy amount (~20%). The eventual goal, if you’re a longer-term player, might be to have the stop “loosen” so that it’s below the 200-day moving average, a line that often contains a stock’s entire big-picture upmove. Finally, you can always change the stop if something really changes—massive-volume distribution or clear abnormal action. But barring that, you want to let the stop work for you by keeping you in a longer-term move.
How I Used Trailing Stops on Twilio
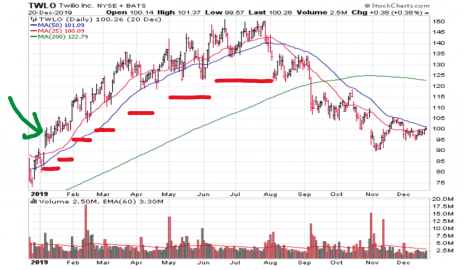
Let’s look at a detailed example from 2019 using Twilio (TWLO).
OK, let’s look a bit closer at those scribbles; each note corresponds to one of the red stop levels.
First, the messy green arrow is the assumed buy point, when TWLO stock gapped to new highs after the late-2018 market meltdown. The initial loss limit would probably be in the low 80s—about 15% from the entry point, which made sense given the extreme volatility in TWLO and the market back then.
The stock worked its way higher the next week or two, so you nudge your stop up a bit—but still giving it plenty of leeway.
Then TWLO started to get some sea legs—pushing into the 115 area, resulting in close to a 20% gain. That was enough to bump the stop-loss to breakeven-ish.
The stock then pulled back sharply to the 25-day line a couple of times before pushing to higher highs in March. That prompted another hike in the stop, but still gave shares more room to breathe. This, by the way, would have been a decent time to book partial profits after a solid, multi-month run.
April was mostly a corrective month, but support was found near the 50-day line and TWLO pushed back to new highs—though it quickly ran into selling after earnings in early May. The stop could have been raised again at that point, albeit keeping it under the lows of the prior few weeks, somewhere in the 120 area.
Happily, TWLO pushed higher from there, but again, it didn’t get very far, with resistance popping up in the 150 area. The stop was raised again into the May lows, in the 125 area.
And you see what happened after that—the stock fell apart and tripped the stop as cloud software stocks fell apart in August. And it didn’t stop falling until it got back down to 90 later that year.
As with all trailing stop methodologies, you’re going to give some up at the end of the trend—in this case, selling near 125, compared to the high around 150. If that’s not for you, there’s nothing wrong with taking profits on the way up. But this is the sort of stop-hiking process I usually go through for my winning trades.
Do you use trailing stops on your trades? If so, do you use your broker’s mechanical trailing stops or your own mental stops?
[author_ad]
*This post has been updated from a previously published version.


