Oil prices have fallen off a cliff this month, dipping to their lowest point ($42 a barrel) since last August. And what do you know - energy stocks have tanked along with them.
Here’s how some of the top energy stocks have performed in June, as crude oil prices have tumbled more than 14%:
Chevron (CVX): +1.3%
Chesapeake Energy (CHK): -9.5%
ConocoPhillips (COP): +1.2%
Exxon Mobil (XOM): +1%
PetroChina (PTR): -5%
Royal Dutch Shell (RDS-B): -4.2%
Not all of those recent performances are disastrous. But not a single one of them has beaten the market this month.
[text_ad use_post='129622']
Now, I could give you a long-winded explanation as to why each of those big oil stocks is tanking—declining revenues, evaporating profits, fewer drilling sites, etc. But the real reason Wall Street has sold out of energy stocks these last few weeks is far more simple: oil prices have fallen.
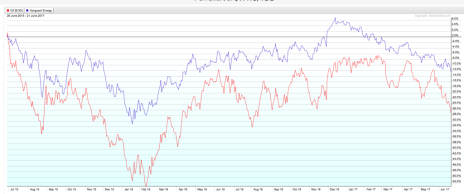
Want to know how tethered energy stocks are to oil prices these days? Look no further than this two-year chart comparing the movement in West Texas Crude oil prices with that of the Vanguard Energy ETF (VDE), whose largest holdings include XOM, CVX, COP and Schlumberger (SLB).
It’s not an exact correlation, but it’s close. As oil prices go, so go energy stocks. When crude oil nose-dived from $50 to less than $30 in late 2015 and early 2016, energy stocks cratered along with it. Conversely, when prices crept back above $50 a barrel when OPEC decided to turn off the tap last December, the VDE made a big upward leap.
Financial analysts devote a link of ink and web space to breaking down, stock-by-stock, why stocks in the energy sector move up or down in a given day, week or month. They should save their breath (or, more accurately, their typing fingers). In the end, the thing that drives energy stocks up or down is pretty simple: oil prices.
That’s oversimplifying it a bit. Chesapeake Energy, for example, has a huge natural gas business. But natural gas prices and oil prices tend to move somewhat in tandem. So really, when oil prices tumble, it sinks—or at least temporarily submerges—all boats in the energy sector.
For oil stocks, the magic number is $50. When oil prices are at least at that level, most energy stocks fare well. From the beginning of December to early March, when crude oil stayed above $50, the VDE was up. The minute that oil prices dipped below $50 again, energy stocks began to slide—they’re down 11% since the second week of March.
Bottom line: if you’re an energy investor, don’t overthink things. To know whether it’s a good time to load up on energy plays, the first thing you should do is look at what’s going on with oil prices. If they’re plunging the way they are now, I’d stay away. In fact, I’d stay away at least until crude oil gets back above its 50-day moving average, which is currently around $48 a barrel.
[author_ad]

