If you’ve read me for any length of time, you know I’m not someone who throws out wild predictions or pounds the table when sharing my view; sure, I like to run through potential scenarios so I’m ready for whatever happens (one famous trader said “you can’t predict what the market will do, but you can be ready for whatever it does”), but our entire market timing system is based on taking things as they come—sticking with the evidence, which will keep us on the right side of the market’s major trends … and that itself will keep you ahead of 80% of investors.
But that’s the big idea with my Cabot Wealth Daily write-up today: If you simply look at what’s going on in the market, you’ll see the market is displaying all sorts of bull market behavior—not just “better than 2022,” which is admittedly a low bar, but we’re now seeing a bunch of things that usually flash if the market’s turned the corner and a new bull market is getting underway.
“But Mike, what about the Fed, the possibility of recession and this week’s inflation report?” At day’s end, those factors don’t have a good history of spotting turning points in the market. Don’t get me wrong, I’m not saying the Fed or the economy doesn’t matter, but the market is looking ahead six-ish months and its own action is a much better forecaster than the news or even the Fed.
So in this article, let’s run through a handful of major pieces of evidence that have completely changed tune from 2022—and strongly hint a new bull move could be underway.
[text_ad]
Long-Term Trend
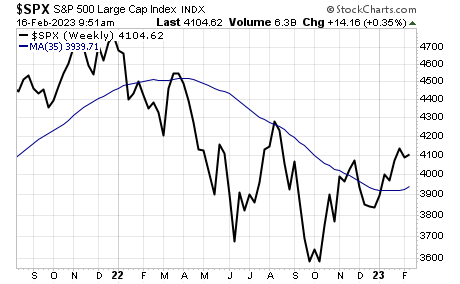
Here’s something you don’t hear much about on the news, but it might be the most reliable timing indicator out there: The long-term trend of the market has turned up, with all major indexes living above long-term moving averages (and in some cases, even those moving averages are starting to trend up). Our own Cabot Trend Lines turned negative in late January 2022 and never sniffed positive ground all year—but they flipped back to bullish a couple of weeks ago and remain so today.
Broad Market Health
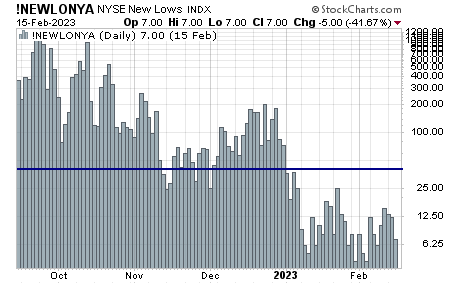
The major indexes are key when timing the market, but it’s important to realize the broad market usually leads the way—it tops before the major indexes (weighted toward big-caps) do, and usually shows life before the major indexes do during a bear market. Our favorite way of measuring the broad market’s health is by looking at the number of stocks hitting 52-week price lows on any given day. For the NYSE, we call that figure our Two-Second Indicator (because it takes just two seconds to check each day), and figures below 40 are (generally speaking) a sign of health.
In 2022, there were just 25 days of 40 or fewer new lows on the NYSE, about 10% of the total. So far in 2023 … every single day has had fewer than 40 new lows, including 15 days of 10 or fewer (compared to zero in 2022)! Yes, it can change, but a month and a half of bullish readings is certainly a great sign.
Defensive Stocks Falling Behind
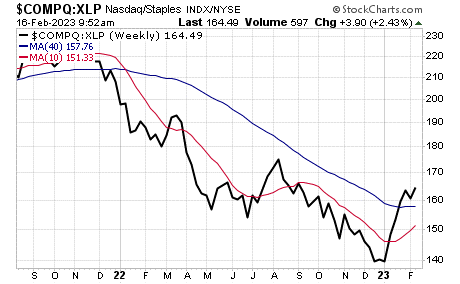
I’ve written about our Aggression Index (ratio of the Nasdaq to consumer staples stocks) many times, and while I do have some buy and sell “rules” around it, the indicator is best used as a background measure—in bad markets, defensive stocks (like consumer staples) do well while growth measures (like the Nasdaq) fade, while the opposite is true in good markets. Last year, the Aggression did perk up for a bit in the spring and again in the summer, but neither time did the Index get close to its 40-week line, which was screaming lower.
Now, though, we again see a change of character, with the Index moving above its 40-week line and holding as the 10-week moves up. Interestingly, the chart is even better looking when examining the equal-weighted Nasdaq 100, which balances out the huge weightings of Apple, Microsoft, Google, etc.
2-to-1 Blastoff Indicator
Major market lows are almost always accompanied by some sort of “blastoff,” where the market either (a) goes from very oversold to very overbought in a short period of time, or (b) simply gets hyper-overbought (my term)—both of which suggest a sudden, bullish change in investor perception.
The problem: Just about everyone has their own blastoff measures these days, including some that are super short-term or measure narrow parts of the overall market, and those are far more failure prone. But I follow two indicators in this genre that have been around for decades and have always worked at least decently—and often flash near the start of new bull markets. And one flashed on January 12.
That was the 2-to-1 Blastoff Indicator, which turns green when the advancing stocks on the NYSE average more than twice the declining stocks over a 10-day period. There have only been a dozen or so signals since 1960, and the performance has been spectacular, with the S&P 500 posting an average maximum gain of 12%, 17% and 25% after three, six and 12 months (respectively). So far, the signal is off to a good start.
Sentiment
OK, OK, I’m throwing this one in here even though sentiment isn’t really a primary indicator for me. Still, one of the things that caught my attention near year’s end and into January is that we saw a crystallization of bearish opinion—CEOs (90%-plus expected a recession), economists (highest percentage expecting a recession in 60 years!), institutions (lots of cash and bonds, underweight stocks) and individuals (outflows from equity funds and ETFs at multi-year highs) all agreed bad times were coming.
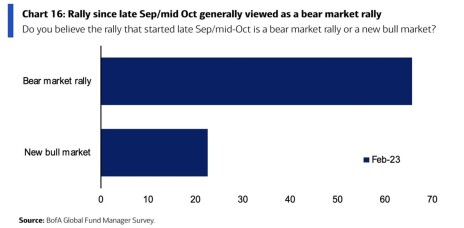
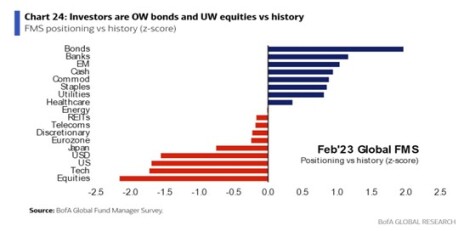
And, according to the latest Bank of America survey of institutional investors (just out this week), there’s still plenty of doubt out there—two-thirds think the current upmove is just a bear market rally and not a new bull market, and they’re most underweight equities, the U.S. and tech stocks, while huge overweight in bonds and cash.
I started my career with Cabot back in 1999 and have seen quite a few “never before seen” events, from terrorism to the popping of the Internet bubble to $150 oil to a housing crash to a pandemic and quantitative tightening and easing. But to me, this looks fairly classic—a tedious, multi-month bear phase that destroyed many highflyers and took investor sentiment down with it, and then one-by-one, key indicators turning positive even as the news is bad and relatively few people believe the latest upmove.
There are never any sure things in the market, but if you’ve been defensive, the evidence is starting to send a message: The buyers are taking control.
[author_ad]

