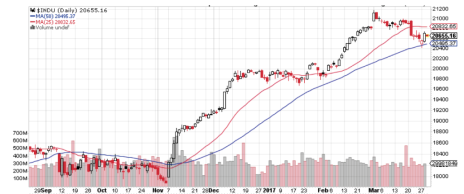
On Monday, investors were worried that we might be in the early stages of a stock market collapse. The Dow Jones Industrial Average, which had reached an intraday high at 21,169 on March 1 (and hit a new record-high close at 21,116), was in trouble. After an eight-day correction that included a hellish drop on high trading volume on March 21, the Dow was down to 20,551 and nicked its 50-day moving average during the day. You can see it clearly on this daily chart.
But the dip in the Dow was only a bit less than 2.7%, and had eaten up only about half of the Dow’s 5.6% rally in February. Still, investors, as a group, are like a flock of sheep who get nervous when anything gets threatening. And the internet is full of people who make their living by making investors nervous. Forecasting a stock market collapse is always excellent click bait.
In the market terms used by professionals, this pullback didn’t even qualify as a correction. It takes a 10% decline to qualify for that term. And it certainly wasn’t a bear market, which would mean a 20% pullback.
[text_ad use_post='129622']
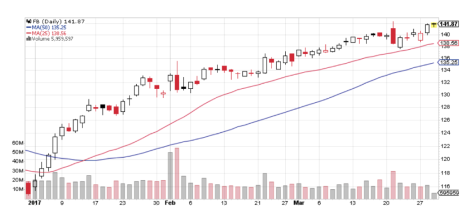
But it certainly got the attention of growth investors, the brave souls whose portfolios get their annual gains by finding stocks whose prices make outsized advances during the year. Growth investors (at least the successful ones) know that one stock like Facebook (FB) can send results soaring, as long as they keep their losses small. This year-to-date chart of FB is a little deceiving, as the stock spent the last couple of months of 2016 rebuilding its base after an early November gap down. But an even longer chart would show that FB has been in a long-term uptrend since June 2013, soaring from 25 to 142 in the process, so the stock’s reputation as a great growth stock really isn’t debatable.
The real question is, how do you keep your equilibrium during pullbacks like the one the Dow staged earlier this month?
One simple answer is that you look at how the index is performing versus its 25- and 50-day moving averages. You can see that the Dow just nicked its lower (50-day) moving average on Monday. (It’s the blue line.) And you can also see that the Dow bounced off that 50-day and has stayed above it since. (The S&P 500 has done the same thing.)
If the Dow had fallen below its 50-day, and stayed there, that would have been a genuine sign of market weakness. And as a growth investor, you would have been prudent to cut back on your buying and taken a sharp look at your growth portfolio with an eye to flushing out your losers and lagging stocks.
Keeping an eye on the major indexes and their moving averages is a great way to avoid the jitters when markets get turbulent. And when we actually get a correction or bear market or even a stock market collapse—which will certainly happen sometime in the future—knowing how to react will make you a much calmer investor.
[author_ad]


