It’s popular to scoff at the phrase, “This time it’s different,” and I’d like to discuss that sentiment before we dive into inverse ETFs.
It’s true that reacting to market conditions rather than having an all-weather strategy usually results in a lower return.
That doesn’t mean you should simply buy and hold and hope for the best. Instead, it means acknowledging that market cycles may have elements in common but do, in fact, differ from previous cycles.
It’s useful to apply another well-known phrase: “History doesn’t repeat itself, but it rhymes.”
[text_ad]
In this current market, it’s clear that things are quite different from recent cycles, going back to the 2000 dot-com meltdown and the 2007-2009 bear market.
Since you’re reading this, you’re already among those who are paying close attention to the conditions potentially driving the broad-market decline. These include, of course, the Russia/Ukraine war, supply-chain disruptions, ongoing concerns about Covid, inflation, rising interest rates, and the looming threat of a recession.
From that perspective, there’s never been an investment era like this one. That means as investors and traders, we need to evolve our approach to everything regarding the financial markets.
In practice, what does that mean?
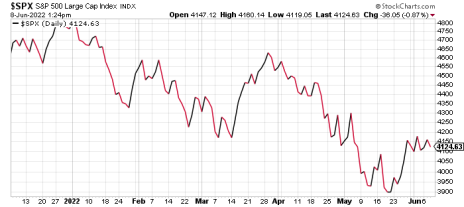
For starters, it means framing what’s likely to happen next. Now that a busy couple of weeks of earnings and Fed speak have passed, the market will try to rally. In fact, we’ve seen that recently, with the S&P 500 attempting to rally from an intra-day low of 3,858 on May 12 and again from a low of 3,810 on May 20.
Does that mean this will be a sustained rally and that May 20 low will hold? Absolutely not. I’m not saying that because I have some special insight into market conditions or because I’ve identified some sophisticated technical indicator that everyone else has missed.
No. But it’s true that markets often flash false rally signals (sometimes repeatedly) before going into a confirmed uptrend.
For example, in late 2008 and early 2009, the market appeared to climb out of a trough on several occasions before finally capitulating in March 2009.
At this juncture, heading into mid-year, if the current rally attempt fails, it may be among the biggest negative market factors yet in 2022. Because at the end of it all, it’s the movement of prices that matters, not anyone’s theory of why the particular market action is occurring.
In the meantime, look to exploit any rallies by notching up stock exposure tactically, while expecting every bounce to top out quickly until the market proves otherwise.
So what does that mean in practice?
It’s always important to understand what you hold, and why.
Inverse ETFs: Zag While the Market Zigs
For instance, some inverse ETFs have been strong performers in the recent broad market downturn. Of course, given the recent rally in the S&P 500, those inverse ETFs have lagged, and bear watching.
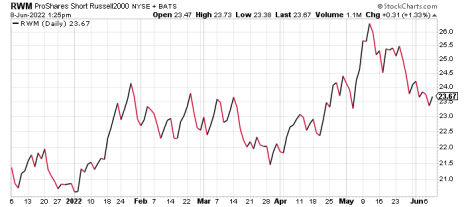
As an example, here’s a chart for the ProShares Short Russell 2000 ETF (RWM). This ETF is down for the week, following the broad equity market rally.
RWM seeks a return that is one times the inverse return of the Russell 2000 small-cap index for a single day. Inverse ETFs like this one are commonly used to hedge against market declines, as a way to profit from declines and to underweight exposure to a particular market segment.
Keep in mind: The Russell 2000 index has returned a gain of 2.2% in the past week and 7.5% in the past month. Domestic small caps as an asset class are underperforming the S&P 500 year-to-date.
The corollary to that is the outperformance of RWM relative to IWM and even the SPY. Year-to-date, RWM boasts a gain of 14.9%, roughly the inverse of the IWM’s year-to-date decline.
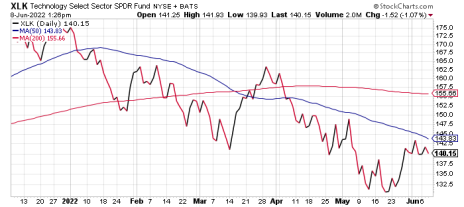
A key part of your ETF trades hinges on using the technical indicators, such as moving-average support and resistance, rather than simply investing based on a hunch about the story. A good example is underperformance of the Technology Select Sector SPDR ETF (XLK), relative to the broader market.
Although few would argue against a bright future for the tech industry as a whole, the current technical signals indicate that money is best deployed elsewhere to book profits at this time, instead of sitting through a continued pullback.
The XLK ETF retreated below its 50-day moving average on January 5, and confirmed that weakness on January 13.
For investors willing to give a security a little more latitude, XLK showed weakness at its 200-day line in late February and early April.
In addition, the 50-day moving average crossed beneath the 200-day line on March 15, offering an early indication that the ETF was technically weak. For an even earlier signal, watch shorter-term moving averages. XLK’s 10-day moving average fell below the 50-day line way back on January 13, while its 21-day line dropped below the 50-day on January 21.
Those bearish crossovers can be used as signals that your security is showing weakness at the moment, and may be considered a sell candidate.
If you want to know what other ETFs I’m currently recommending, consider taking out a subscription to my Cabot ETF Strategist advisory, where we recommend ETFs of all stripes to help you diversify your portfolio spread out your allocations.
Do you own any inverse ETFs? Tell us about them in the comments below.
[author_ad]


