We all know the Federal Reserve has been on a historic interest rate hiking cycle since the beginning of 2022, loudly banging the drum that rates will be “higher for longer.”
That’s translated into more than a year and a half of living through wild market swings as investors digest policy forecasts and commentary from hawkish FOMC members.
Given more of the same at the Fed’s September meeting last week, and a subsequent breakout in interest rates (the 10-year rate now at highest level since 2007), I wanted to look at exactly how large and small-cap stocks have handled the various phases of this hiking cycle.
While there are no easy answers to what comes next, hopefully, some perspective will help investors better understand the impact of “higher for longer” interest rates on equities. And how that relationship could play out as we move toward the Q3 earnings season and into 2024.
[text_ad]
First, let’s set the table.
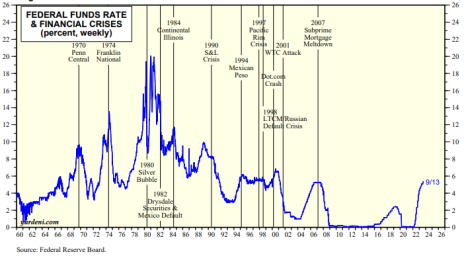
The chart below from Yardeni Research plots the federal funds rate (FFR) since the 1960s along with notes on significant events. As you can see the FFR, now at 5.25% to 5.5%, hasn’t been this high since the 2007 subprime mortgage financial crisis.
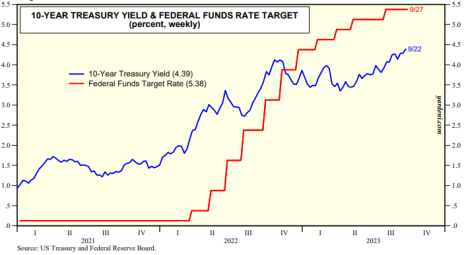
The next chart, also from Yardeni Research, takes a closer look at the FFR (red line) and the 10-year Treasury Yield (blue line) since the pandemic began, through last week.
As you can see, once the pandemic broke out the Fed slashed the FFR to zero and kept it there until early 2022. As the Fed began hiking the FFR the 10-year yield trended higher too (a rational response), ultimately peaking last summer around 4.3%.
Then the 10-year yield bounced around in the 3.5% to 4% range, until just recently.
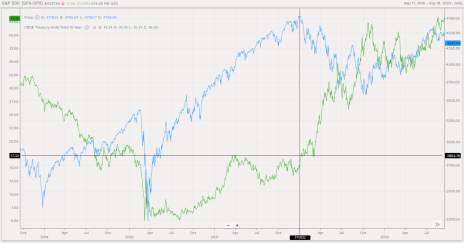
Things get interesting when we compare the performance of the S&P 500 Index (blue line, right scale) over the last five years to the trend in the 10-year yield (green line, left scale), as in the next chart.
As you can see, stocks did great when interest rates were at zero in 2020 and 2021 (not a huge surprise). The rally persisted right up until the end of 2021. That’s when the Fed indicated that they were going to start jacking up the FFR, the 10-year yield moved above about 1.75% and the bull market in stocks came to an abrupt end.
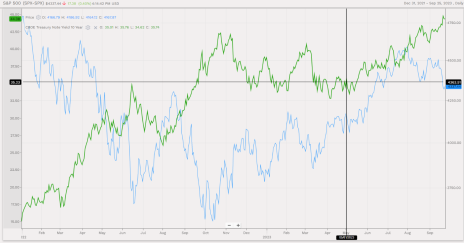
Now, if we zoom in to the period since the beginning of 2022 you can clearly see how the S&P 500 has mostly moved in the opposite direction as compared to the 10-year yield.
This is the big-picture relationship that’s been shoved in our faces for over a year. As yields go up, stocks tend to fall.
But that’s not always the case. The most glaring recent exception to that relationship was in the three-month period from May through July 2023. During those three months, the market trended higher even though the 10-year yield also went up, from 3.5% to 4.2%.
Why? The simplest answer is that the stock market, which is forward-looking, was beginning to price in an end to the Fed’s hiking cycle.
However, more recently, the market has been on edge again as the 10-year yield bumped up against the 4.2% area. And when yields broke higher after the FOMC meeting last week, stocks broke lower – the result of the Fed’s “higher for longer” forecast.
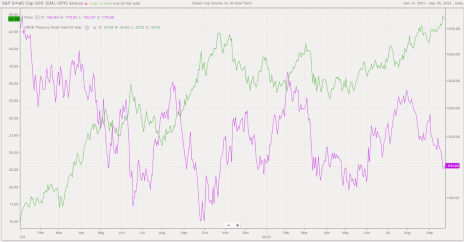
Turning to small-cap stocks (purple line in chart below), the general relationship with the 10-year yield has been the same since early 2022 as with large caps, but moves were a little more pronounced.
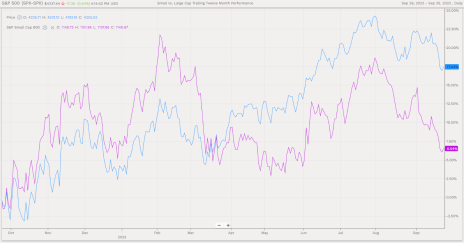
And as the following chart shows, small caps have underperformed large caps over the last two years. Unfortunately for holders of small-cap index funds, that’s also been the case over the last one-, five- and ten-year periods. It’s small consolation small is slightly beating large over the last three years.
So, what can we infer from all this?
Staying at a very high level and acknowledging that there are a million caveats to any attempted conclusions, we can safely say that it’s not as simple as higher yields mean stocks struggle, and small caps struggle more.
It’s more likely that higher yields above a certain level, combined with all the speculation that comes with uncertainty, means stocks struggle.
That’s where we are right now. Yields are relatively high and going higher while at the same time, there are more questions than answers about really big, important things. Like where the economy and job market will go, will we have a functioning government in a week, etc.
The market hates uncertainty. And we have a bunch of it.
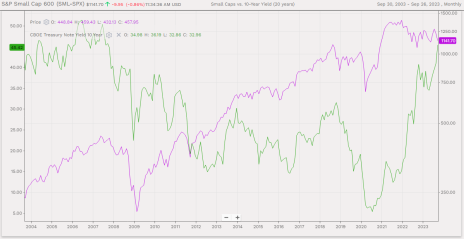
Back to the stock-yield relationship, take a look at this 20-year chart of small caps versus the 10-year yield.
There are plenty of examples of time frames when both went higher at the same time. And also, a lot of examples of stocks doing very well for extended periods once rates flattened out and started to come down.
This is why many of us at Cabot believe that the market’s next big move will be higher. It’s just a matter of getting through this messy period of uncertainty to a time when stocks can shake free of the downward pressure of rising rates and investor focus can return to stock-specific catalysts.
Assuming, of course, the Fed doesn’t break anything major pursuing its goal of beating inflation to a pulp with its pledge to keep rates higher for longer.
[author_ad]

