Our Spotlight Stock this month became a common household name to many investors during the tech revolution. The Internet/mobile chip provider not only managed to survive the boom and bust, but has come out on top of the growing semiconductor sector for low-cost chips for the exploding biometrics identification industry. Nancy’s Feature further explores the tremendous demand for biometrics around the world.
Wall Street’s Best Dividend Stocks 296
[premium_html_toc post_id="133904"]
Market Views
Still Going Long
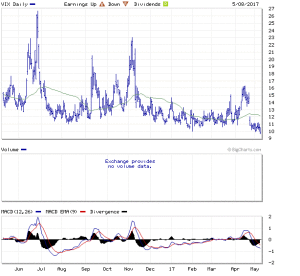
The VIX dropped below 10 for a little while on Monday. That was only the 20th day since 1992 that the index clocked in at a single-digit reading. Bespoke Investment Group notes that low volatility stretches tend to occur in clusters every 10 years or so. The first occurred in 1993, the second from 2005 to 2007 and the third has come this year.
Contrary to conventional wisdom, the historical record shows that these low-volatility streaks do not tend to lead directly to market trouble. The 1993 example occurred ahead of one of the greatest stretches for the market in history, peaking seven years later. After the first 2005 example, the market did not peak for two years.
This does not mean the low-volatility trade can’t fail. Recently, shorting fear has been a magic money tree on Wall Street. In fact, the last time the haul was better came ahead of the 2008 financial crisis. Then, collateralized debt obligations were held in the same high regard. We all know how that ended.
Near term, the trend is of utmost importance. Right now, all signs point to more of the same. Right now, legendary trader Jesse Livermore would be short volatility and long the strongest stocks. He would let the market pick winners, dictate direction.
Jon Markman, Pivotal Point Trader, issues@e.moneyandmarkets.com, 1-800-291-8545, May 8, 2017
Bears Still in the Game
The equity-only put-call ratios have diverged over the last week or so. The weighted ratio continues to decline and thus remains on a buy signal, but the standard ratio is on a sell.
Market breadth is the most bearish of the indicators right now. Both breadth oscillators are now on sell signals. We often want to see another indicator confirming a breadth sell signal because the breadth signal can be erratic at times. However, the sell signal can’t be ignored completely.
The bulls continue to await the upside breakout. However, the bears are still in this game. If $SPX closes below support, a test of the March lows would be in order. So, once again we await confirmation from $SPX before a move can be “certified,” and that confirmation has been very difficult to come by since mid-March.
Lawrence G. McMillan, The Option Strategist, www.optionstrategist.com, 973-328-1303, May 5, 2017
To read the rest of this month’s issue, download the PDF.
THE NEXT Wall Street’s Best Dividend Stocks WILL BE PUBLISHED May 10, 2017
Neither Cabot Wealth Network nor our employees are compensated by the companies we recommend. Sources of information are believed to be reliable, but are in no way guaranteed to be complete or without error. Recommendations, opinions or suggestions are given with the understanding that subscribers acting on the information assume all risks. © Cabot Wealth Network. Copying and/or electronic transmission of this report is a violation of U.S. copyright law. For the protection of our subscribers, if copyright laws are violated, the subscription will be terminated. To subscribe or for information on our privacy policy, call 978-745-5532, visit www.cabotwealth.com or write to support@cabotwealth.com.
