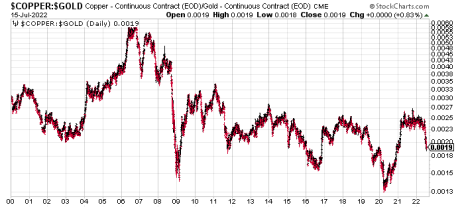
The Bullish Message of Copper/Gold
It’s no secret that gold is, historically, the world’s most widely preferred safe-haven asset in times of economic turmoil. Gold’s polar opposite is copper, which typically benefits the most when the global economy is strong.
By looking at both metals—separately and together—we can get a “snap shot” view of the market’s expectations for the economy’s near-term (six-to-12-month) performance. We can also get some potentially useful trading clues for both metals—and even for silver—when we look at the copper-to-gold ratio.
The copper/gold ratio prices copper in gold terms. It basically tells you the number of ounces of gold it takes to buy an ounce of copper. This ratio is useful for not only gauging the economy’s strength, but it also has a remarkable track record of being able to predict the direction of 10-year Treasury yields.
A less well-known use for the copper/gold ratio is its utility in signaling when copper prices are technically “oversold” after a big decline and therefore vulnerable to short covering activity. Analyst Jay Kaeppel, the editor of Kaeppel’s Corner, has pointed out that after copper’s nearly 40% crash in recent months, the copper/gold ratio has reached an extreme level that has been associated with copper bottoms in the last 14 years.
Specifically, whenever the ratio has fallen under 0.19, there has been a pronounced tendency for copper to rally soon after this signal since the 2008 credit crisis. As of July 18, the copper/gold ratio is just under this level after falling some 25% in just the last six weeks.
In fact, a 14-year statistical survey of how copper performs whenever the copper/gold ratio plunges below 0.19 shows that in every case without exception, copper made meaningful price gains in the six to 12 months following the signal. The red metal’s average gain following the bullish ratio signal was 28% six months later, and 52% 12 months later.
Kaeppel’s research has also shown that a reading under 0.19 in the copper/gold ratio is typically bullish for silver’s near-term outlook. For the first time in almost a year, the ratio is below 0.19, and that signal has preceded meaningful rallies in the iShares Silver Trust (SLV) in every case since 2008. (Incidentally, last week’s plunge under 0.19 was only the sixth time since 2008 this signal has happened.)
To be exact, the favorable copper/gold signal saw average gains of 10% one month later, 25% two months later, 28% six months later and 37% a year later. To be fair, the biggest part of these gains can be attributed to the huge rallies that followed the 2008 and 2020 market crashes.
Does this mean it’s time to jump in with new purchases of our favorite copper- and silver-tracking ETFs? In my judgment, it’s still too early to make the assumption that the absolute price low has been made in both metals. That said, given the admittedly “oversold” nature of the broad metals market combined with the bullish seasonal tendencies of the precious metals in the current timeframe, a new confirmed buy signal could occur at any time in the next several days. When it finally happens, we’ll look to take advantage of it via our favorite tracking funds, but for now patience is still in order.
Updates
Alliance Resource Partners (ARLP) is a producer of metallurgical coal (for the steelmaking industry) and thermal coal (for electrical utilities), with approximately two billion tons of coal reserves in several U.S. midwestern and southern states. Alliance is currently the second-largest coal producer in the eastern U.S. with additional mineral and royalty interests in the highly productive Permian, Anadarko and Williston basins. (The company markets its mineral interests for lease to operators in those regions and generates royalty income from the leasing and development of those mineral interests.) ARLP has been one of the few standouts in an otherwise weak market as coal prices surge around the world (forming what one analyst called a “space needle pattern”) in response to the recent natural gas crisis in Europe. Consequently, many industry experts foresee shortages and sky-high energy prices persisting until at least 2024. I suggest raising the stop-loss on the remaining position to slightly under 19 (closing basis) where the 50-day line currently resides. HOLD A HALF
We were stopped out of our conservative trading position in the Global X Lithium & Battery Tech ETF (LIT) last week when the 69.70 level was violated on a closing basis. While lithium still has some strong tailwinds fundamentally, I suggest waiting for the leading lithium stocks to show some meaningful technical improvement before we take another swing in this space. SOLD
Portfolio
| Stock | Price Bought | Date Bought | Price on 7/18/22 | Profit | Rating |
| Alliance Resource Partners (ARLP) | 18.75 | 7/5/22 | 20.85 | 11% | Hold a Half |
| Global X Lithium & Battery ETF (LIT) | 75.8 | 6/28/22 | 71.1 | -6% | Sold |
Buy means purchase a position at or around current prices.
Buy a Quarter/Half means allocate less of your portfolio to a position than you normally would (due to risk factors).
Hold means maintain existing position; don’t add to it by buying more, but don’t sell.
Sell means to liquidate the entire (or remaining) position.
Sell a Quarter/Half means take partial profits, either 25% or 50%.
