The Big Boys Play When the Little Guys Run Away
After a stellar performance in 2020 and a so-so 2021, gold has been one of this year’s biggest disappointments. After a promising rally in the first quarter, gold fell 17% from its March peak of $2,050 an ounce to $1,700 just two weeks ago.
But the decline looks like it may have finally ended in a classic “washout” with small investors running away while market-moving commercial players have lately jumped in as buyers—potentially good news from a contrarian perspective. What’s more, the picture painted by recent CBOT Commitments of Traders statistics suggest heavy commercial buying interest across virtually every major metal category (including silver, copper and steel).
A recent Wall Street Journal article by Hardika Singh observed that investors in recent months have been worried that the latest inflation data could push the Fed toward “more aggressive” interest rate increases to cool down inflation. This worry has had the effect of pushing U.S. government bond yields higher while weighing on gold (which, WSJ reminds us, doesn’t pay a dividend).
The WSJ article voiced the rhetorical question many investors have undoubtedly asked themselves throughout the past year, namely: “Why am I holding gold and paying to hold it when it really hasn’t performed as an inflation hedge?” Individuals aren’t the only ones asking this question apparently, as hedge funds and other speculators have recently turned bearish, according to WSJ, “for the first time in more than three years.”
This mass exodus away from gold and gold-related investments in recent weeks has occurred just as the “smart money” commercial hedgers have drastically reduced their short positions in gold and silver. Recent data also suggest they’ve backed off their bullish outlook on the dollar (at least in the short term). Collectively, this evidence paints a potentially bullish picture for gold in the coming weeks—especially if the dollar begins to weaken.
On that score, there is mounting evidence that the slowing U.S. economy will prompt the Fed to slow the pace of its rate increases. Indeed, at its last FOMC meeting, the Fed encouraged this outlook by increasingly the fed funds rate by 75 basis points instead of the originally intended 100 basis points.
Fed Chairman Jerome Powell also indicated the Fed’s decision on whether or not to slow the pace of rate hikes will depend on economic data in the coming weeks and months. He further suggested that “it intuitively makes sense that slowing the pace of rate increases would be appropriate,” should the economy continue to soften. This would presumably put downward pressure on Treasury yields and the dollar, in turn allowing gold an opportunity to recover.
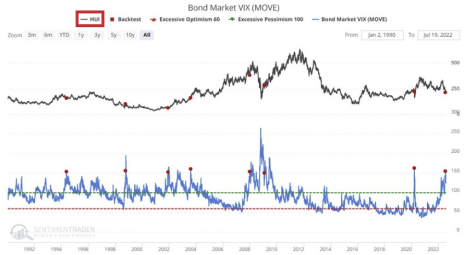
Turning our attention to gold stocks, the actively traded miners are in the best technical position in years to establish a major bottom. That’s the conclusion of a recent deep dive into the historical data by statistics guru Jay Kaeppel. In a recent edition of his Kaeppel’s Corner newsletter, he observed that there is a distinctive inverse correlation between the NYSE Arca Gold Bugs Index (HUI) and the so-called “VIX Index” for bonds, which measures the implied volatility of options on Treasury bond futures.
Since 1990, whenever the bond market VIX rose above a level of 150, it coincided in each case with an intermediate-term bottom for the HUI. This is illustrated in the following chart that compares the HUI (top line) with the bond VIX (bottom indicator).
According to Kaeppel’s research, whenever this correlation occurred (and it just did in late July), the average aggregate return (or “win rate”) for gold stocks two months and six months after the signal was made was an astounding 86% across both time frames. (The only exception was the 1998 signal, which happened to occur against a backdrop of crashing commodities prices exacerbated by the LTCM hedge fund fiasco.)
A final consideration—as we’ve been talking about in the last few weeks—is that seasonal factors are in gold’s favor starting around early August and extending into early October. While seasonal considerations will always be secondary to the more paramount technical and fundamental factors governing gold’s short-term trend, it’s nonetheless encouraging that if the bulls are indeed making a run on gold right now, they’ll have a positive seasonal tailwind at their back for the next two months.
All told, the evidence is starting to mount that this could finally be gold’s proverbial hour in the spotlight. Yes, the metal has consistently disappointed us since March, but other metals are showing signs of life as well. We’ll take a closer look at these strengthening metals in the coming days. Plus, I’m adding another position to our model portfolio (below) based on the recent improvement.
Updates
Alliance Resource Partners (ARLP) is a producer of metallurgical coal (for the steelmaking industry) and thermal coal (for electrical utilities), with approximately two billion tons of coal reserves in several U.S. midwestern and southern states. Alliance is currently the second-largest coal producer in the eastern U.S. with additional mineral and royalty interests in the highly productive Permian, Anadarko and Williston basins. (The company markets its mineral interests for lease to operators in those regions and generates royalty income from the leasing and development of those mineral interests.) ARLP has been one of the few standouts in an otherwise weak market as coal prices surge around the world (forming what one analyst called a “space needle pattern”) in response to the recent natural gas crisis in Europe. Consequently, many industry experts foresee shortages and sky-high energy prices persisting until at least 2024. During Q1, the company’s average realized coal price was $47 per short ton—some $20 per short ton under prevailing Illinois basin coal prices (coal prices have since quintupled!). This should allow Alliance to achieve record cash flows in the foreseeable future. When earnings are released on August 1 (after this update went to print), the consensus expects revenue to increase 55% from a year ago with per-share earnings expected to jump 177%. On a technical note, I suggest raising the stop-loss on the remaining position (after our recent profit-taking move) to slightly under 19.60 on a closing basis, where the 50-day line currently resides. HOLD A HALF
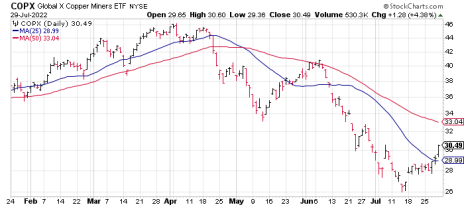
Our recent examination of the copper/gold ratio revealed that copper tends to rally when the ratio falls under 0.19, which it did recently. A 14-year statistical survey further shows that in every case without exception, copper posted a meaningful price gain (i.e. between 30% and 50%) in the six-to-12 months following the signal. With that in mind, participants who don’t mind the short-term volatility risk can purchase a conservative position in the Global X Copper Miners ETF (COPX) using a level slightly under 28 as the initial stop-loss on a closing basis. BUY A HALF
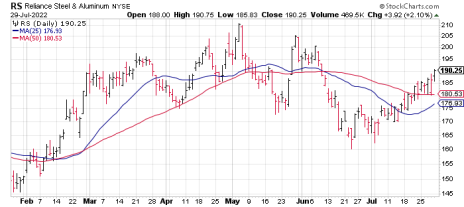
Reliance Steel & Aluminum (RS) is the largest metals service center operator in North America, providing metals processing, inventory management and delivery services for several industries, including construction, energy, electronics, automotive and aerospace. Reliance expects its average selling price per ton sold for the third quarter of 2022 to be down 5%, due to recent weakness in aluminum and steel prices. Despite this, however, the company sees improving demand and pricing for higher value products sold into the aerospace, energy and semiconductor end markets. In Reliance’s just-released Q2 report, revenue of $4.7 billion was 37% higher from a year ago and surprised estimates to the upside. Per-share earnings of $9.15, meanwhile, beat estimates by 13 cents. Looking ahead to Q3, management sounded a sanguine note, observing that “customers tend to hold less inventory in times of declining metal prices and increase their reliance on us to provide the metal they need quickly and more frequently, as well as to fulfill their value-added processing needs.” Wall Street expects Q3 sales to increase 8% with full-year sales expected to jump 20%, both of which could prove too conservative if the dollar weakens and the industrial metals market reignites. In view of the strong relative performance of this dual steel/aluminum company in recent weeks, traders can purchase a conservative long position in RS using a level slightly under 175 as the initial stop-loss (closing basis). BUY A HALF
The Sprott Physical Platinum & Palladium Trust (SPPP) is arguably the lowest-cost way to play a potential palladium market short-covering rally. As mentioned above, I view this as an asymmetric trading opportunity given the strong short-covering trend among commercial hedgers in the palladium market. Moreover, the white metals should be prime beneficiaries of China’s reopening from recent Covid-related shutdowns as industrial activity (particularly in the automotive sector) ramps up again. However, because this ETF is coming off a major low and doesn’t enjoy the tailwind of forward momentum (as most of my recommendations do), it also represents an above-normal volatility risk. For that reason, I’m not recommending this trade for conservative traders. That said, participants who don’t mind the risk recently purchased a small position in SPPP using a level slightly under 12.60 as an initial stop-loss (closing basis). BUY A HALF
Valhi (VHI) is a leader in the titanium industry. The company has operations through majority-owned subsidiaries or less than majority-owned affiliates operating in several industries, including component products (security products, furniture components and performance marine components) and titanium metals products. But its biggest segment by sales is titanium dioxide pigments, which are used in the automotive and construction industries, as well as in plastic and printing inks. Its main titanium oxide subsidiary is Kronos (KRO)—whose stock was recently a (profitable) part of our trading portfolio. On the financial front, Valhi posted revenue of $629 million in Q1, up 24% from a year ago, led by higher titanium oxide selling prices and volumes in its chemical segment. Per-share earnings of $1.59, meanwhile, beat estimates by 34 cents. When the company reports Q2 earnings on August 11, analysts expect EPS to grow 170% from a year ago and over 25% sequentially. In view of VHI’s strong relative performance in the last few weeks, traders purchased a conservative position in this stock using an initial stop-loss slightly under 41.60 (closing basis). BUY A HALF
| Stock | Price Bought | Date Bought | Price on Aug. 1 | Profit | Rating |
| Alliance Resource Partners (ARLP) | 18.75 | 7/5/22 | 22 | 17% | Hold a Half |
| Global X Copper Miners ETF (COPX) | 30.5 | 8/2/22 | 30.5 | 0% | Buy a Half |
| Reliance Aluminum & Steel (RS) | 190.25 | 8/2/22 | 190.25 | 0% | Buy a Half |
| Sprott Physical Palladium Trust (SPPP) | 13.5 | 7/26/22 | 14 | 4% | Buy a Half |
| Valhi Inc. (VHI) | 48 | 7/20/22 | 51 | 6% | Buy a Half |
Buy means purchase a position at or around current prices.
Buy a Quarter/Half means allocate less of your portfolio to a position than you normally would (due to risk factors).
Hold means maintain existing position; don’t add to it by buying more, but don’t sell.
Sell means to liquidate the entire (or remaining) position.
Sell a Quarter/Half means take partial profits, either 25% or 50%.


