With short-covering activity no longer a factor, gold remains in a tenuous position on a short-term basis. A strengthening 10-year bond yield and a robust dollar are further headwinds for the metal.
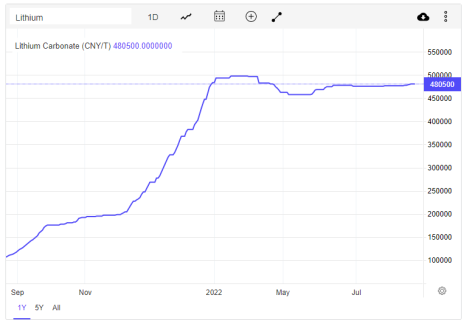
Lithium, meanwhile, is back in a commanding lead among the key industrial metals—thanks in part to the newly passed Inflation Reduction Act law.
In the trading portfolio, no new positions are recommended for now as the broad metals market is unsettled.
Cabot SX Gold & Metals Advisor Issue: August 23, 2022
What’s Driving Gold Right Now?
Inflation, Short-Covering No Longer in Driver’s Seat
In last week’s issue, I noted that short interest was no longer the driving force for gold—and indeed for most other base and precious metals. It was fun while it lasted, but last month’s short-covering rally in the broad metals market is clearly over. If the metals are to continue to push higher from here, factors other than short-covering must come into play.
With that said, it’s necessary that we address the issue of what are now—and likely will be—the key drivers for gold and the other metals going forward. Let’s start with gold, which for many investors remains an enigma since it has been unable (for the most part) to leverage economic and geopolitical worries to its advantage in the past several months.
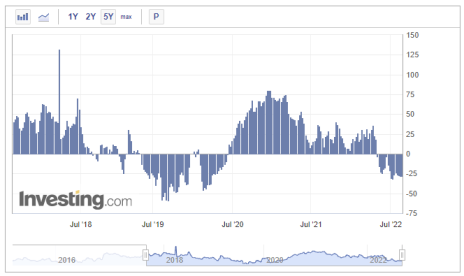
Many investors are still asking why gold (historically an inflation hedge) has been unable to get a sustained rally going in the past year in the face of the highest U.S. inflation rate in 40 years? My explanation for gold’s underperformance since the early March peak at $2,050 an ounce is that near-term inflation expectations have been diminishing.
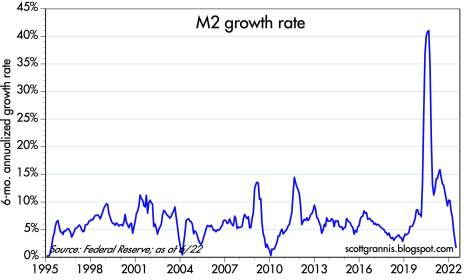
Markets are forward-looking, and informed investors have no doubt been motivated to reduce their gold holdings by the huge reversal in the six-month annualized growth rate for M2 money supply (see chart below) in recent months. This trend suggests that inflation pressures will likely continue diminishing on a near-term basis, as evidenced by the recent declines in oil and gasoline prices.
An editorial observation by Donald Luskin, chief investment officer of TrendMacro, in The Wall Street Journal provides some further elucidation:
“As of the most recent data…M2 growth stands at just 6.6%, lower than it was immediately before the pandemic. If the relationship with inflation continues, core inflation will be at only 2.3%...by June 2023. If inflation is always and everywhere a monetary phenomenon, that’s baked in the cake—even if it seems too good to be true.”
Moreover, intensifying fear—which is another key driver for gold prices—has been lacking in recent months. Pandemic-related restrictions have been loosened in China and other countries, while the war in Ukraine has commanded fewer headlines lately. Indeed, Americans have seemed content to put geopolitical and economic concerns aside to enjoy a summer characterized by pent-up travel demand.
All things considered, it’s not surprising that gold has lost much of its luster since March. And with fears of a weaker economy no longer predominant, it’s also unsurprising that longer-dated U.S. Treasury bond yields are on the rise once again. This, perhaps more than any single factor, explains gold’s underperformance.
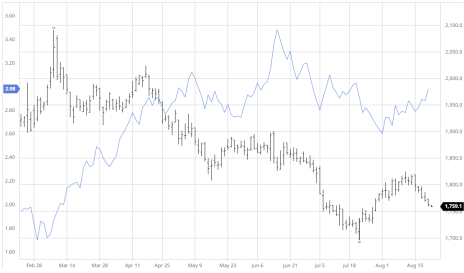
Consider the following graph, which compares the price of December gold futures (black line) with the 10-year Treasury Yield Index (TNX, solid blue line). As you can see, the tendency so far this year is for sustained rallies in TNX to put downward pressure on gold, while extended declines in TNX have eased the pressure and made it easier for gold to rally.
The basis behind the inverse correlation between gold and Treasury yields is easy to guess; investors are more inclined to favor holding government bonds over non-yielding gold when there’s less to worry about. Rising yields further attract even more interest in buying bonds among value-and-safety-oriented investors—in turn reducing gold’s appeal even more.
Underlying the latest strength in longer-dated Treasury yields are expectations of further rate hikes from the Federal Reserve. As noted in a recent Wall Street Journal article, “Investors worry that the latest data…could push the Fed toward more aggressive rate increases to cool down consumer and producer prices,” which has boosted bond yields and “supercharged” a rally in the dollar—both negative factors for gold.
With yields resurging and the dollar currently robust, gold faces a dual headwind going forward that, without the benefit of additional short-covering activity in the futures market, will be hard for the metal to overcome. For this reason, I’m recommending that we maintain an all-cash position for now in the gold portion of our trading portfolio.
What to Do Now
We currently have no trading position in our favorite gold-tracking ETF, the GraniteShares Gold Trust (BAR). No new trading positions are recommended in this or any other gold-related stocks or ETFs until I see some additional improvement, particularly in the gold mining stocks. WAIT
New Recommendations/Updates
Silver’s Hedging Factor Still Favorable
Unlike gold, silver no longer has a favorable seasonal factor in front of it. More importantly, however, silver—unlike gold—still has short-covering potential in the near term.
Silver’s most historically bullish month of the year is July—a point emphasized in this report earlier this summer. After its steep decline from April to June, silver spent a good part of July bottoming out before finally turning up later that month and rallying into mid-August.
Silver’s seasonals are no longer supportive from a bullish standpoint, however, which may partly explain the sagging price since last week. The next seasonally bullish period for silver, incidentally, begins in November and extends into January (the second-strongest month for silver historically).
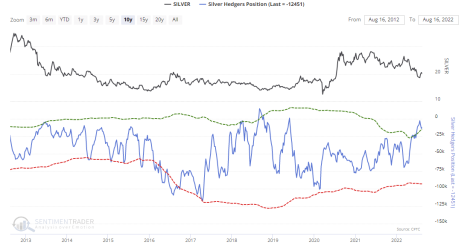
But while we can no longer count on seasonal considerations to come to silver’s aid right now, commercial hedgers are still backing away from shorting the metal. That’s a potentially good sign for the white metal’s intermediate-term outlook. The chart below shows that, based on CFTC data, commercial hedgers (the so-called “smart money” in the futures market) continue to hold more long positions in silver than shorts.
Long positions among small speculators, meanwhile, have fallen to levels not seen since June of 2019 (around the time of a major bottom for silver prices). The latest CFTC Commitments of Traders report suggests speculators’ appetites for owning silver have fallen to extremes normally seen at important junctures.
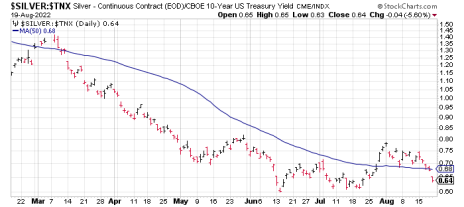
While both pieces of data are a big potential positive for silver prices from an intermediate-term (3-6 month) perspective, silver’s short-term trend has turned decidedly negative since last week. As illustrated in the following graph, the silver versus 10-year Treasury yield (TNX) ratio dropped back under its 50-day line last week. Traditionally, the best times to be long silver—or silver ETFs—is when the ratio is above the 50-day moving average.
What to Do Now
We were stopped out of our conservative trading position in our favorite silver-tracking fund, the iShares Silver ETF (SLV), on August 19 when the 18 level was violated on a closing basis. No further action is warranted in the silver ETF until the near-term technical picture improves. SOLD
The Sprott Physical Platinum & Palladium Trust (SPPP) is arguably the lowest-cost way to play a potential palladium market short-covering rally. As mentioned above, I view this as an asymmetric trading opportunity given the strong short-covering trend among commercial hedgers in the palladium market. Moreover, the white metals should be prime beneficiaries of China’s reopening from recent Covid-related shutdowns as industrial activity (particularly in the automotive sector) ramps up again. However, because this ETF is coming off a major low and doesn’t enjoy the tailwind of forward momentum (as most of my recommendations do), it also represents an above-normal volatility risk. Accordingly, participants who don’t mind the risk recently purchased a small position in SPPP. Last week I suggested booking 50% profit in SPPP after its 11% rally and further suggested raising the stop-loss to slightly under 13.60 (closing basis) on the remaining position where the 50-day line currently resides. We were stopped out of the remainder of our long position on August 23 when this level was violated. SOLD
China Hopes Push Copper Higher
Copper prices continued near recent highs despite worries of a global economic slowdown. The red metal’s price recently hit its highest level since June as hopes for a China economic rebound lifted sentiment.
China is widely expected to lower its benchmark interest rate this week, while pledging to provide additional stimulus in support of its domestic economy. China’s attempts at jump-starting industry through looser monetary policy have so far checked fears that the nation’s real estate crisis will swamp demand for industrial metals like copper.
The latest CFTC data, meanwhile, points to speculative interest among small copper traders being at levels normally seen near major turning points for copper. Specifically, the last time speculative long positions in copper were this low was in late 2019, which proved to be the starting point for a major rally for prices. This is one of the pieces of evidence which supports a continued bullish outlook for the metal.
On the supply front, Comex and LME warehouse copper stocks are at 60-day and 30-day lows, respectively, which could support another attempt at “running the shorts” by the bulls in the near term. Commercial hedgers are also reducing their shorts (bullish) while increasing their long positions in the metal.
Data from research provider Shanghai Metals Market revealed a 24% drop in copper scrap production during July compared to a year ago. Producers reportedly avoided selling copper at “unfavorable” prices during the month.
Additionally, the output of China’s copper cathodes for the first seven months of 2022 missed expectations and was down 0.4%. With supplies dwindling and sentiment plummeting, the odds are still in the copper bulls’ favor.
What to Do Now
Our recent examination of the copper/gold ratio revealed that copper tends to rally when the ratio falls under 0.19, which it did recently. A 14-year statistical survey further shows that in every case without exception, copper posted a meaningful price gain (i.e. between 30% and 50%) in the six to 12 months following the signal. With that in mind, participants who don’t mind the short-term volatility risk recently purchased a conservative position in the Global X Copper Miners ETF (COPX) using a level slightly under 28 as the initial stop-loss on a closing basis. BUY A HALF
China Policies Support Steel
Electricity rationing in China has contributed to further steel mill shutdowns in China which, while putting short-term downward pressure on iron ore prices, should ultimately help stabilize steel prices as supplies from the world’s top producer become more restricted.
Further contributing to lower supplies are the policies of China’s government, which places strictures on annual steel production in order to curb carbon emissions.
Additionally, the recent round of Covid-related restrictions imposed on Taiwan—the world’s 12th-largest steel exporter—and other large cities is expected to further snarl supply chains, which could further boost steel prices in the months ahead.
A recent Mining.com analysis drew attention to China’s “shrinking steel stocks” and further illustrates the improved supply-related situation for the industrial metal. The analysis also noted that China’s steel margins are gradually improving, adding, “Hopes that steel output curbs in China to meet decarbonization goals will be less strenuous in the second half of the year” should support both iron ore and steel prices.
What to Do Now
Alliance Resource Partners (ARLP) is a producer of metallurgical coal (for the steelmaking industry) and thermal coal (for electrical utilities), with approximately two billion tons of coal reserves in several U.S. midwestern and southern states. Alliance is currently the second-largest coal producer in the eastern U.S. with additional mineral and royalty interests in the highly productive Permian, Anadarko and Williston basins. (The company markets its mineral interests for lease to operators in those regions and generates royalty income from the leasing and development of those mineral interests.) ARLP has been one of the few standouts in an otherwise weak market as coal prices surge around the world (forming what one analyst called a “space needle pattern”) in response to the recent natural gas crisis in Europe. Consequently, many industry experts foresee shortages and sky-high energy prices persisting until at least 2024. During Q2, the company’s average realized coal price was $72 per short ton—$25 above the prior quarter’s prevailing price. The recent earnings also revealed the firm’s revenue increased 70% from a year ago, to $617 million, while per-share earnings were $1.23 (29 cents above estimates). Management indicated that coal operations have delivered “significant” year-over-year per ton margin expansion, adding that it sees ARLP well positioned to see further margin growth in 2023 and 2024. Speaking of growth, Mining.com has drawn attention to the record-breaking results of many of the world’s biggest coal producers in the latest quarter, pointing out that “energy market shockwaves from Russia’s invasion of Ukraine mean the world is only getting more dependent on the most-polluting fuel.” This has resulted in “mega profits” for coal giants like Glencore, and the outlook bodes well for firms like Alliance in the foreseeable future. On a technical note, I suggest raising the stop-loss on the remaining position (after our recent profit-taking move) to slightly under 20.25 on a closing basis, where the 50-day line currently resides. HOLD A HALF
Cleveland-Cliffs (CLF), North America’s largest flat‑rolled steel and iron ore pellet maker, just reported mostly upbeat second-quarter earnings. Revenue for the steelmaker in Q2 rose 26% from a year ago to $6.3 billion, while per-share earnings of $1.31 missed estimates by five cents. Other highlights included free cash flow that more than doubled from the prior quarter, plus the firm’s largest quarterly debt reduction since it began its transformation two years ago. The company, which enjoys a leadership position in providing steel for the U.S. automotive industry, expects the enormous backlog for vehicles will result in higher steel demand in the coming quarters, which could help push prices for the metal higher. The stock, meanwhile, is subject to what looks like a growing short-covering squeeze as 9% of the float is currently sold short. Traders recently purchased a conservative position in CLF using a level slightly under 17 as the initial stop-loss on a closing basis. BUY A HALF
Reliance Steel & Aluminum (RS) is the largest metals service center operator in North America, providing metals processing, inventory management and delivery services for several industries, including construction, energy, electronics, automotive and aerospace. Reliance expects its average selling price per ton sold for the third quarter of 2022 to be down 5%, due to recent weakness in aluminum and steel prices. Despite this, however, the company sees improving demand and pricing for higher value products sold into the aerospace, energy and semiconductor end markets. In Reliance’s just-released Q2 report, revenue of $4.7 billion was 37% higher from a year ago and surprised estimates to the upside. Per-share earnings of $9.15, meanwhile, beat estimates by 13 cents. Looking ahead to Q3, management sounded a sanguine note, observing that “customers tend to hold less inventory in times of declining metal prices and increase their reliance on us to provide the metal they need quickly and more frequently, as well as to fulfill their value-added processing needs.” Wall Street expects Q3 sales to increase 8% with full-year-sales expected to jump 20%, both of which could prove too conservative if the dollar weakens and the industrial metals market reignites. In view of the strong relative performance of this dual steel/aluminum company in recent weeks, traders recently purchased a conservative long position in RS using a level slightly under 175 as the initial stop-loss. I now suggest raising the stop to slightly under 180 (closing basis) where the 50-day line currently resides. BUY A HALF
Lithium Prices Supported by New Law
Lithium carbonate prices in China remain close to a record high price of 500,000 yuan per ton as of late August. Prices are also up 400% from a year ago as soaring demand combines with extended supply deficits to create a “perfect storm” for the battery metal.
According to Trading Economics, the latest data from the Shanghai Metals Market suggested a supply deficit of 1,360 tons in July. This reverses a supply surplus during the prior month as the re-opening of the Chinese economy and cash subsidies for electric vehicles (EVs) lifted automaker demand for lithium batteries. Additionally, mid-year maintenance for lithium mine producers has resulted in carbonate output declining 4% in July, to 30,320 tons, from the prior month.
In the U.S., demand for new EVs is widely anticipated to boom in the wake of last week’s passage of the “Inflation Reduction Act” by Congress. The legislation extends tax breaks for new EV purchases and supports a wide range of pro-alternate energy initiatives that should benefit the lithium industry.
Members of the industry are understandably sanguine over the bullish prospects of the new law. Jonathan Evans, president and CEO of Lithium Americas Corp., was quoted by GreenWire as saying the law was a “big deal” and that his company, which is working to build the largest lithium mine in the U.S., is now evaluating the construction of a second U.S. mine in wake of the law’s passage, based on expectations for higher lithium demand.
“Mining companies are expected to see more widespread demand from the auto and battery manufacturing sectors under the law, because of mineral sourcing requirements that must be met to qualify for the new expanded EV tax credit,” GreenWire further noted.
Elsewhere, Chilean miner SQM Lithium (SQM) reported soaring lithium demand in the second quarter, a trend it expects will persist for several more quarters despite ongoing supply delays. The company said it expects global lithium demand will increase 35% this year, and expects its own lithium sales volumes to reach 145,000 tons for 2022.
The head of SQM’s board announced in April the company planned to invest $900 million through 2022 in a bid to expand its lithium carbonate and hydroxide production capacity.
What to Do Now
Ratings firm Fitch pointed out in a recent report that the small presence of major lithium miners in the development of new projects—with undercapitalized junior exploration companies mainly undertaking them—poses a risk to the execution of those projects. In other words, the tight supply situation that has characterized the market since at least 2020 will likely continue. Fitch expressed confidence that most new lithium projects will eventually pan out in the coming years as more experienced players enter the market. However, Fitch cautioned that several of these projects will “face delays” in the intermediate-term with some of them “unlikely to be developed due to the characteristics of the competitive landscape and the location of a number of projects in markets facing significant economic, political, operational and mining risks.” The fundamental backdrop for lithium accordingly remains tight, which supports the strong recovery witnessed in lithium stocks in recent weeks. To that end, I recently placed the Global X Lithium & Battery Tech ETF (LIT) back on a buy. Participants purchased a conservative position in LIT last week using a level slightly under 73.75 (closing basis) as the initial stop-loss. BUY A HALF
Current Portfolio
| Stock | Price Bought | Date Bought | Price on Aug. 22 | Profit | Rating |
| Alliance Resource Partners (ARLP) | 18.75 | 7/5/22 | 25.4 | 35% | Hold a Half |
| Cleveland-Cliffs (CLF) | 18.3 | 8/8/22 | 17.8 | -3% | Buy a Half |
| Global X Copper Miners ETF (COPX) | 30.5 | 8/2/22 | 30.7 | 1% | Buy a Half |
| Global X Lithium & Battery ETF (LIT) | 80.85 | 8/15/22 | 77.8 | -4% | Buy a Half |
| iShares Silver Trust ETF (SLV) | 18.3 | 8/8/22 | 17.9 | -2% | Sold |
| Reliance Aluminum & Steel (RS) | 190 | 8/2/22 | 192 | 1% | Buy a Half |
| Sprott Physical Palladium Trust (SPPP) | 13.5 | 7/26/22 | 13.55 | 0% | Sold |
Buy means purchase a position at or around current prices.
Buy a Quarter/Half means allocate less of your portfolio to a position than you normally would (due to risk factors).
Hold means maintain existing position; don’t add to it by buying more, but don’t sell.
Sell means to liquidate the entire (or remaining) position.
Sell a Quarter/Half means take partial profits, either 25% or 50%.
The next Cabot SX Gold & Metals Advisor issue will be published on September 13, 2022.
Analyst Bio
Clif Droke
Clif Droke is Chief Analyst of Cabot SX Gold & Metals. For over 20 years, he has worked as a writer, analyst and editor of several market-oriented advisory services and has written several books on technical trading in the stock market, including “Channel Buster: How to Trade the Most Profitable Chart Pattern” and “The Stock Market Cycles.”
